
Jordan Morrison
Web Developer | Mobile Developer | Graphic Designer | UX & UI Designer
Portfolio



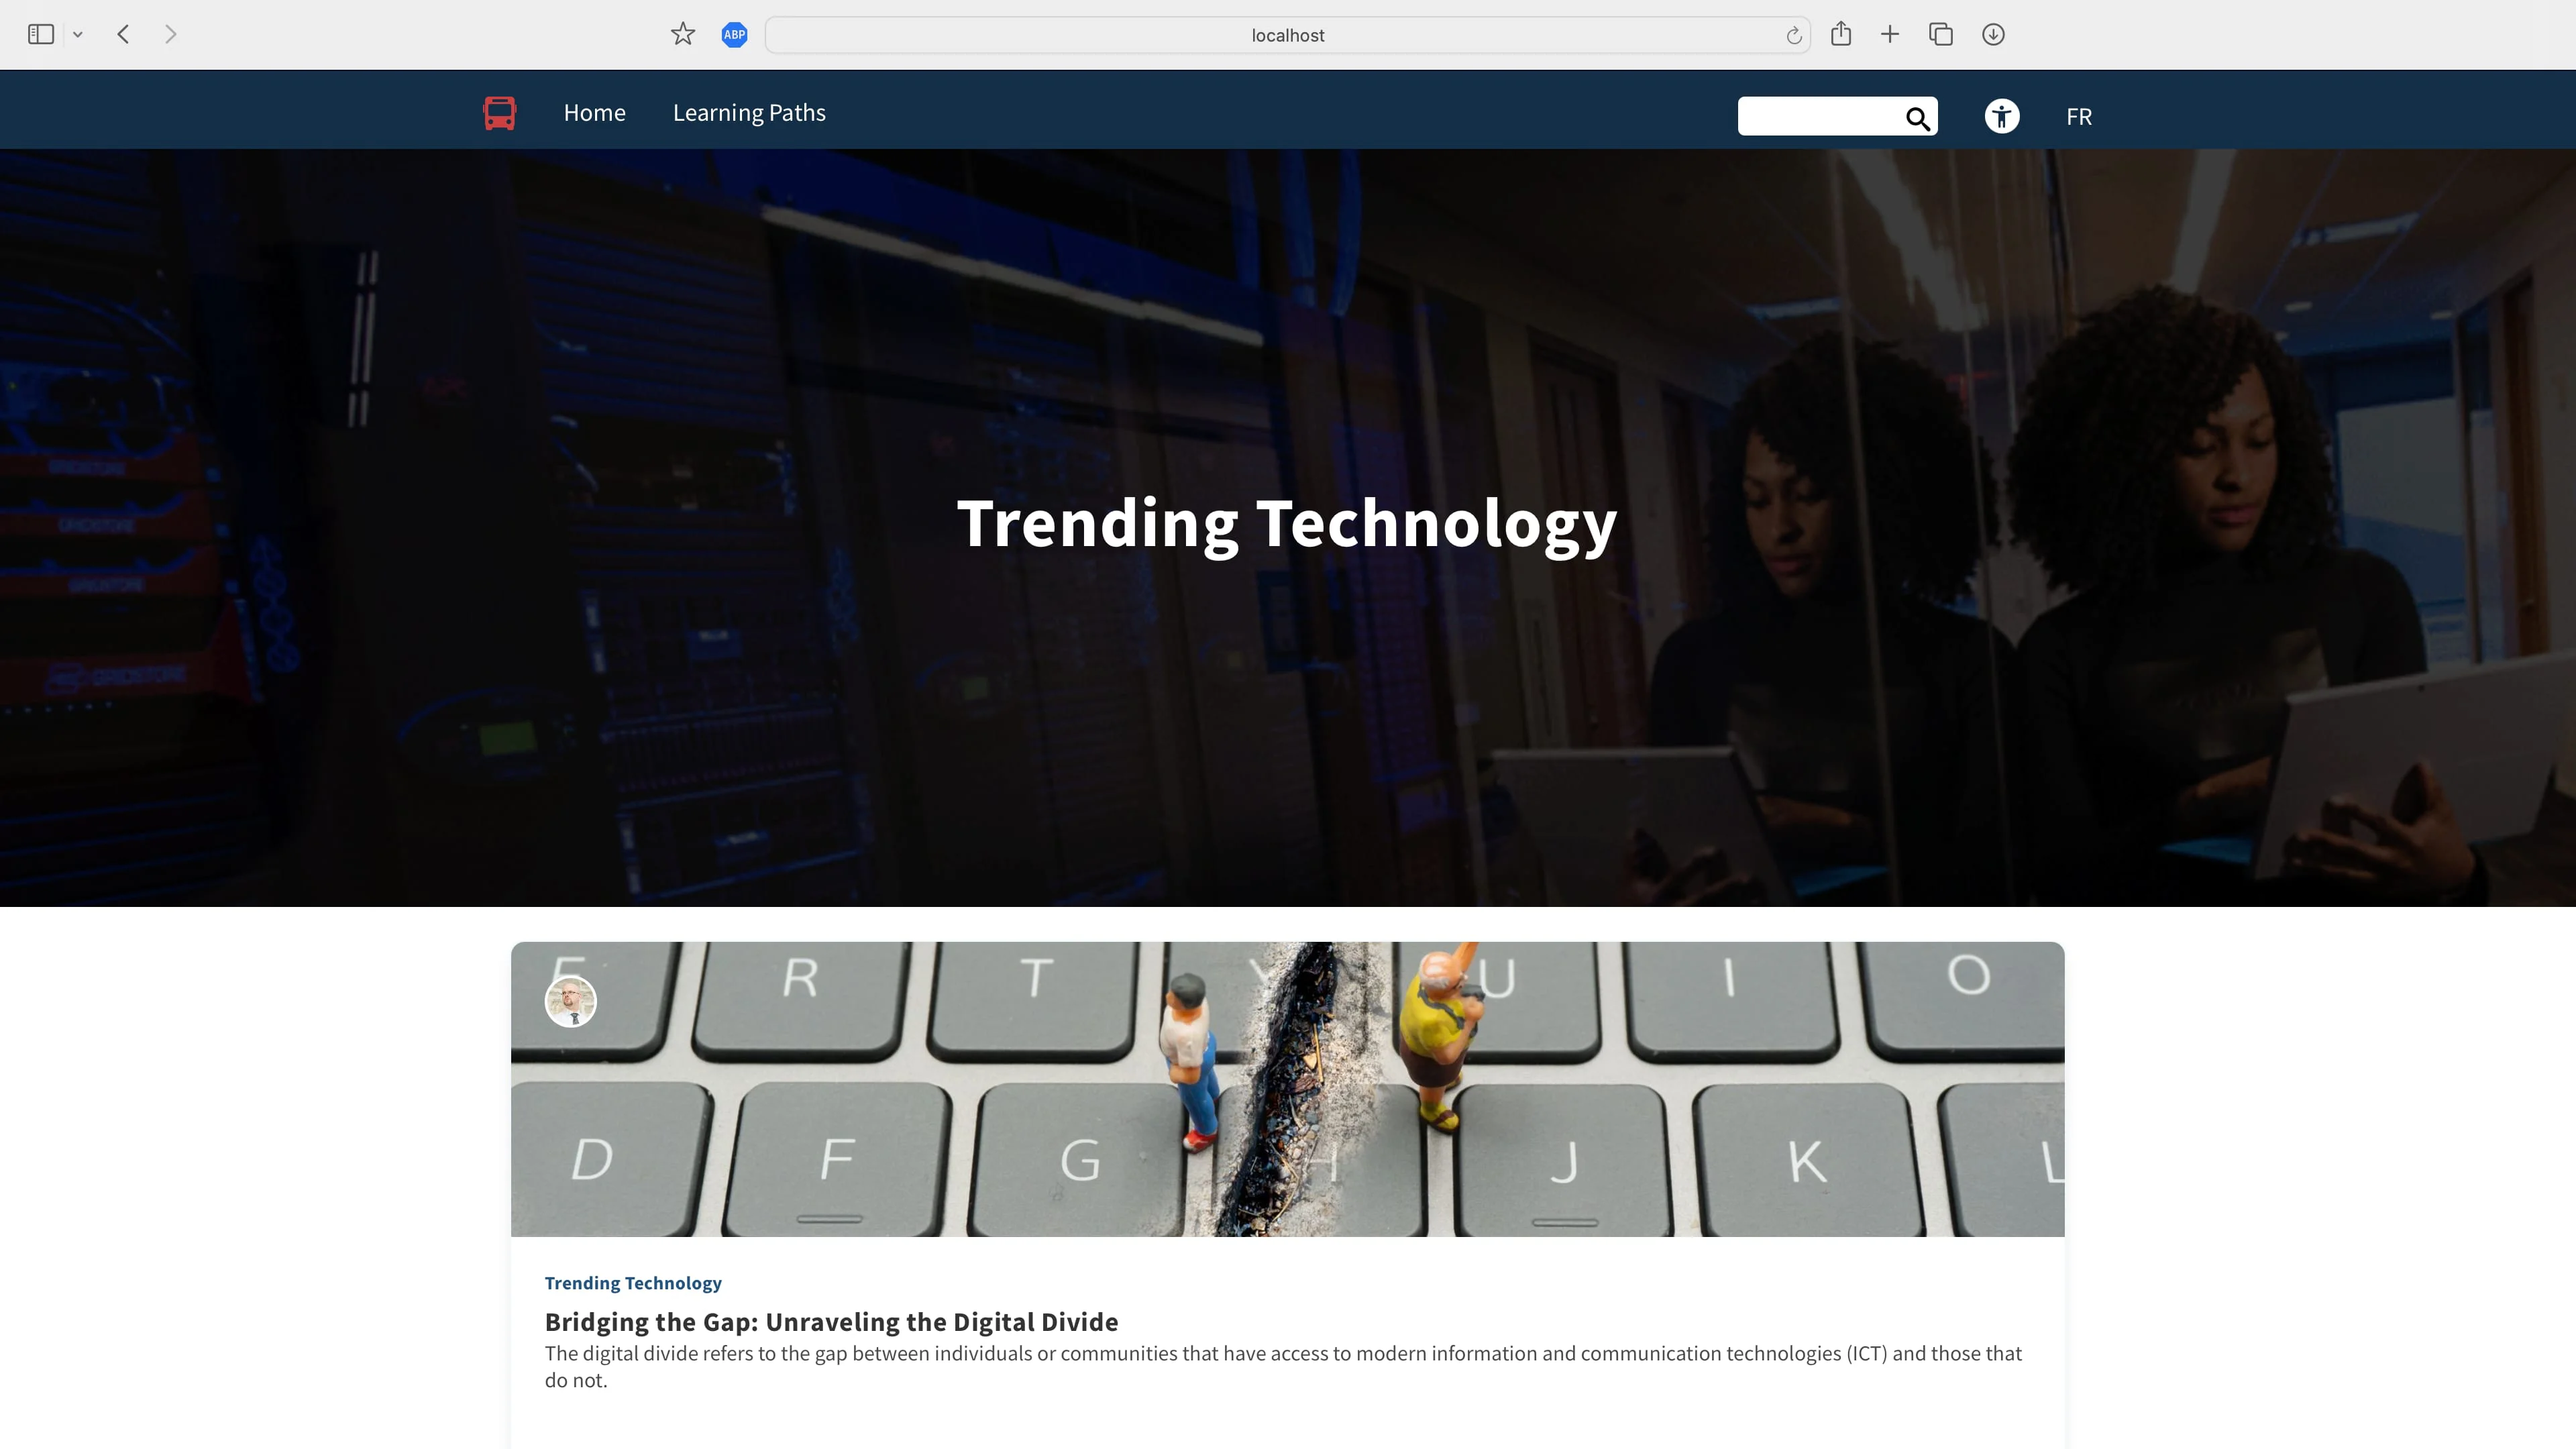
Busrides
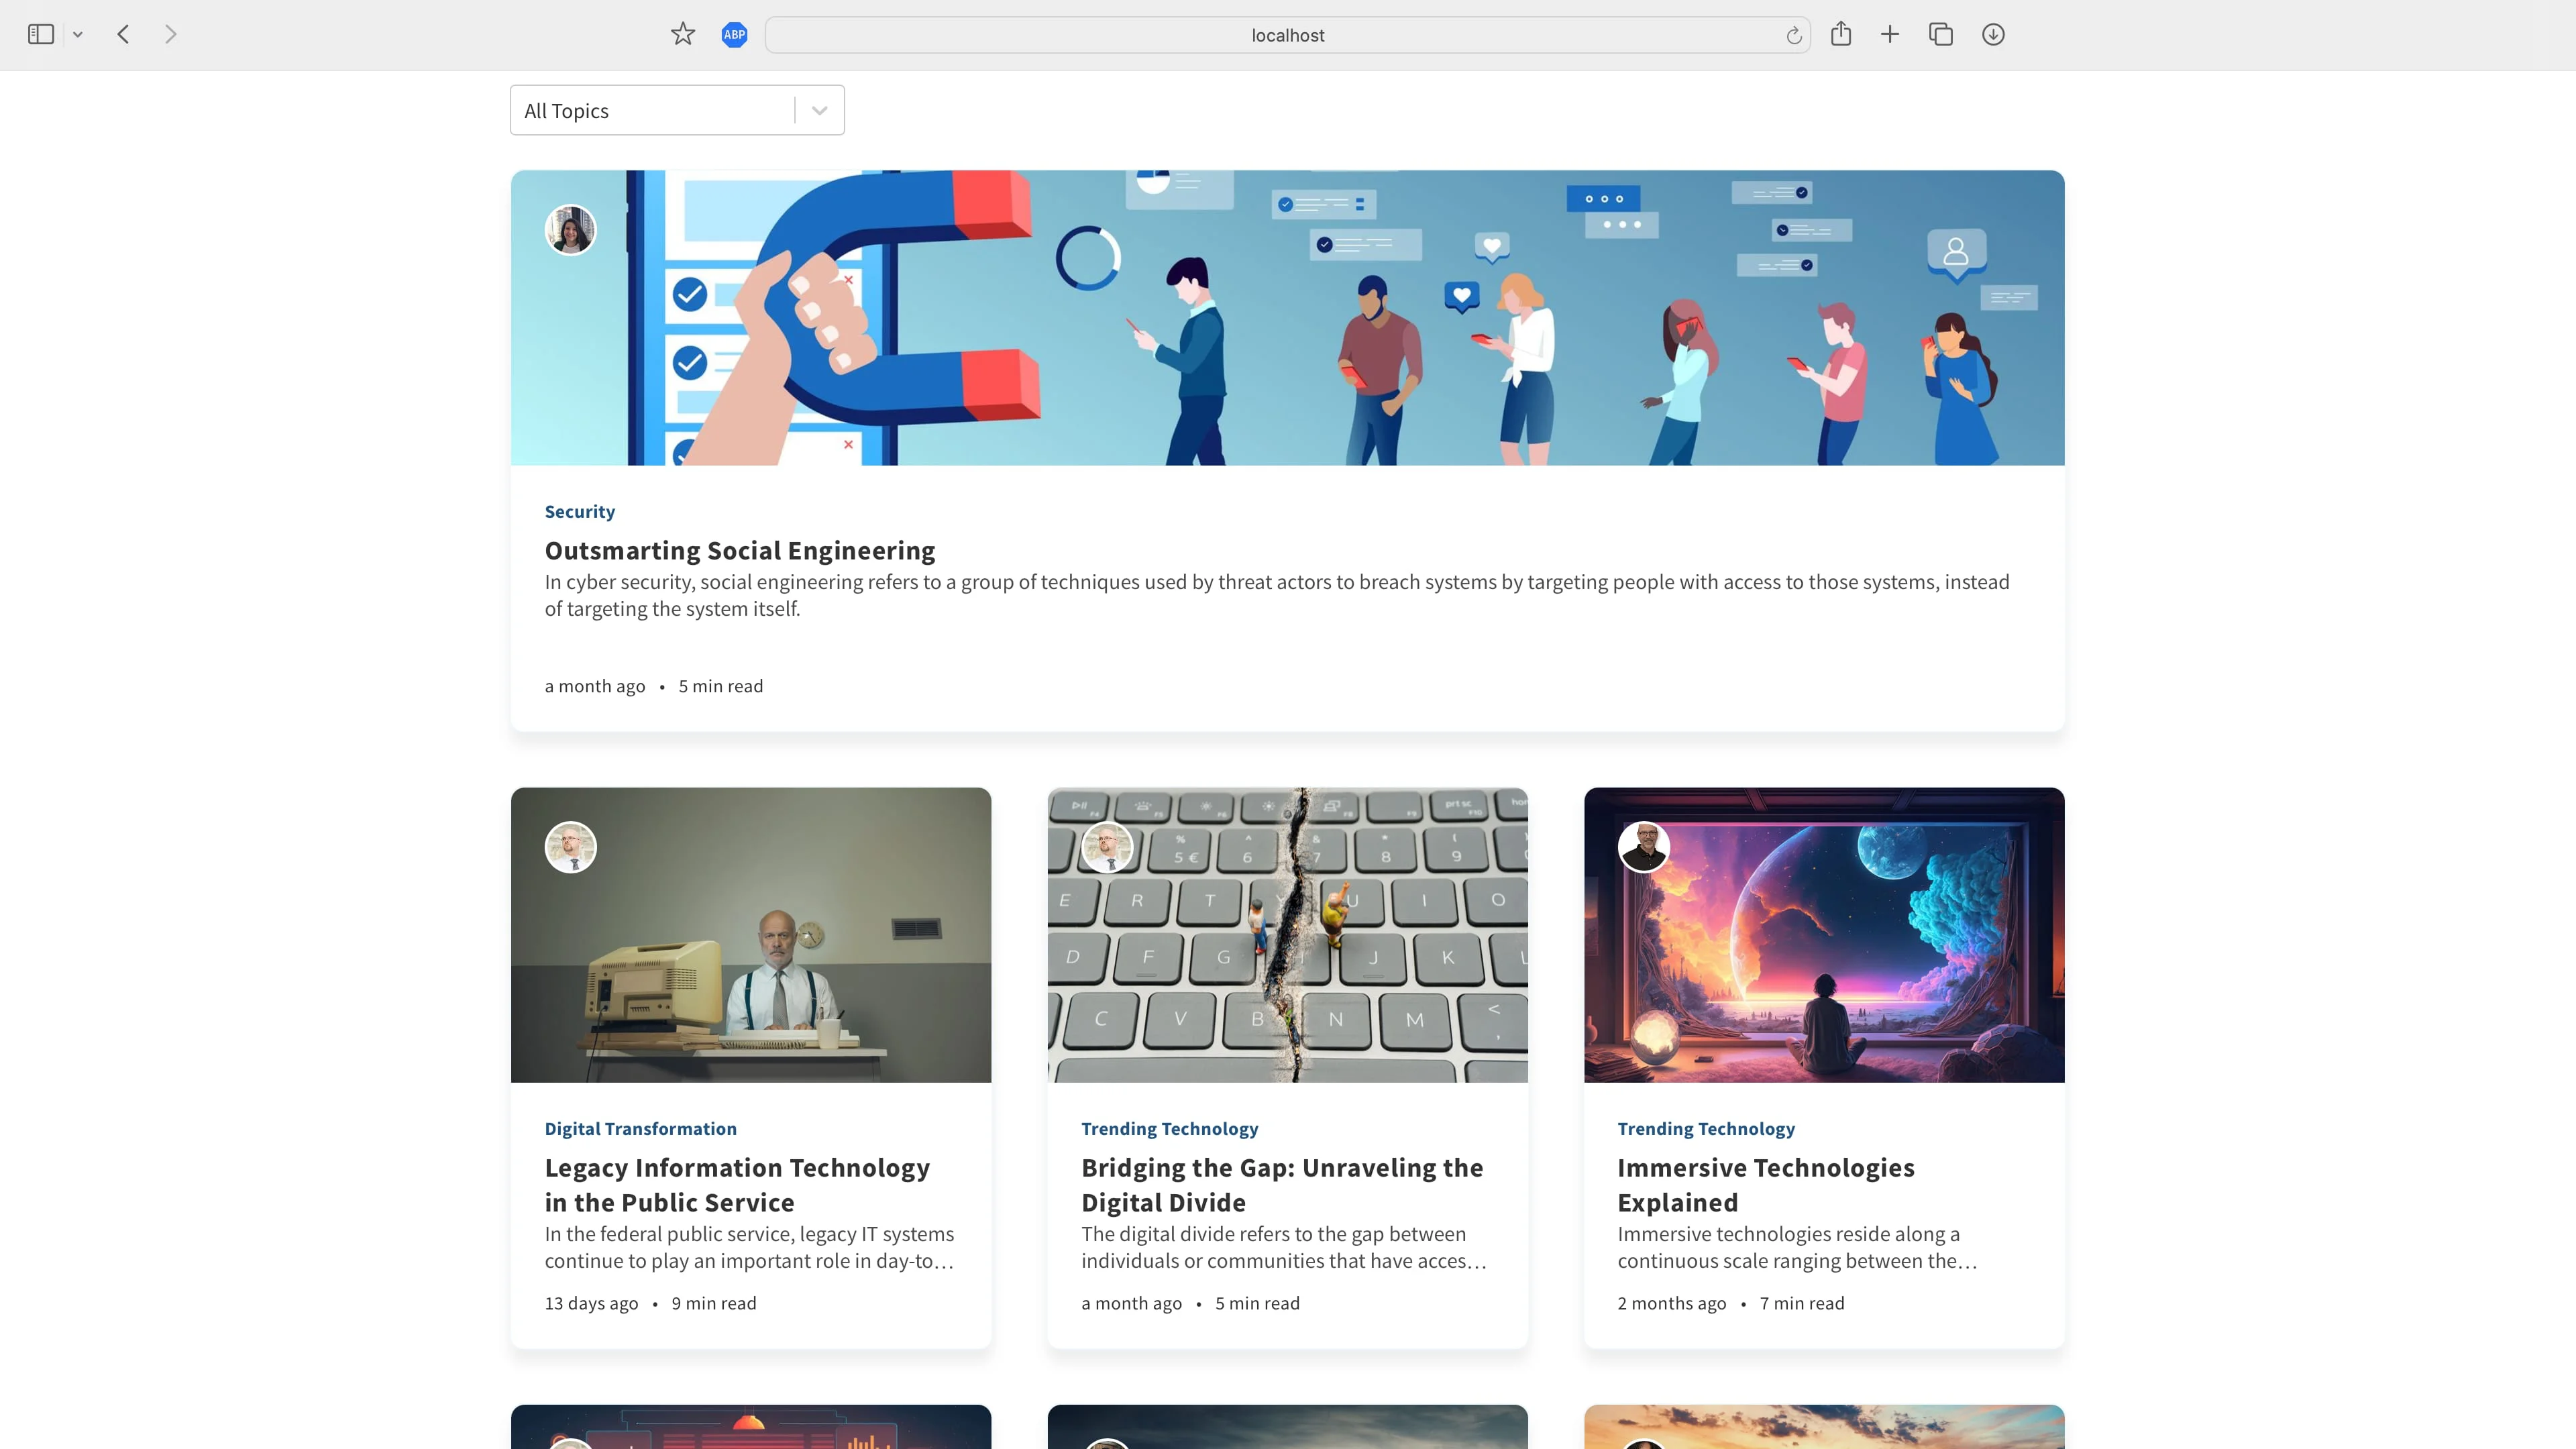
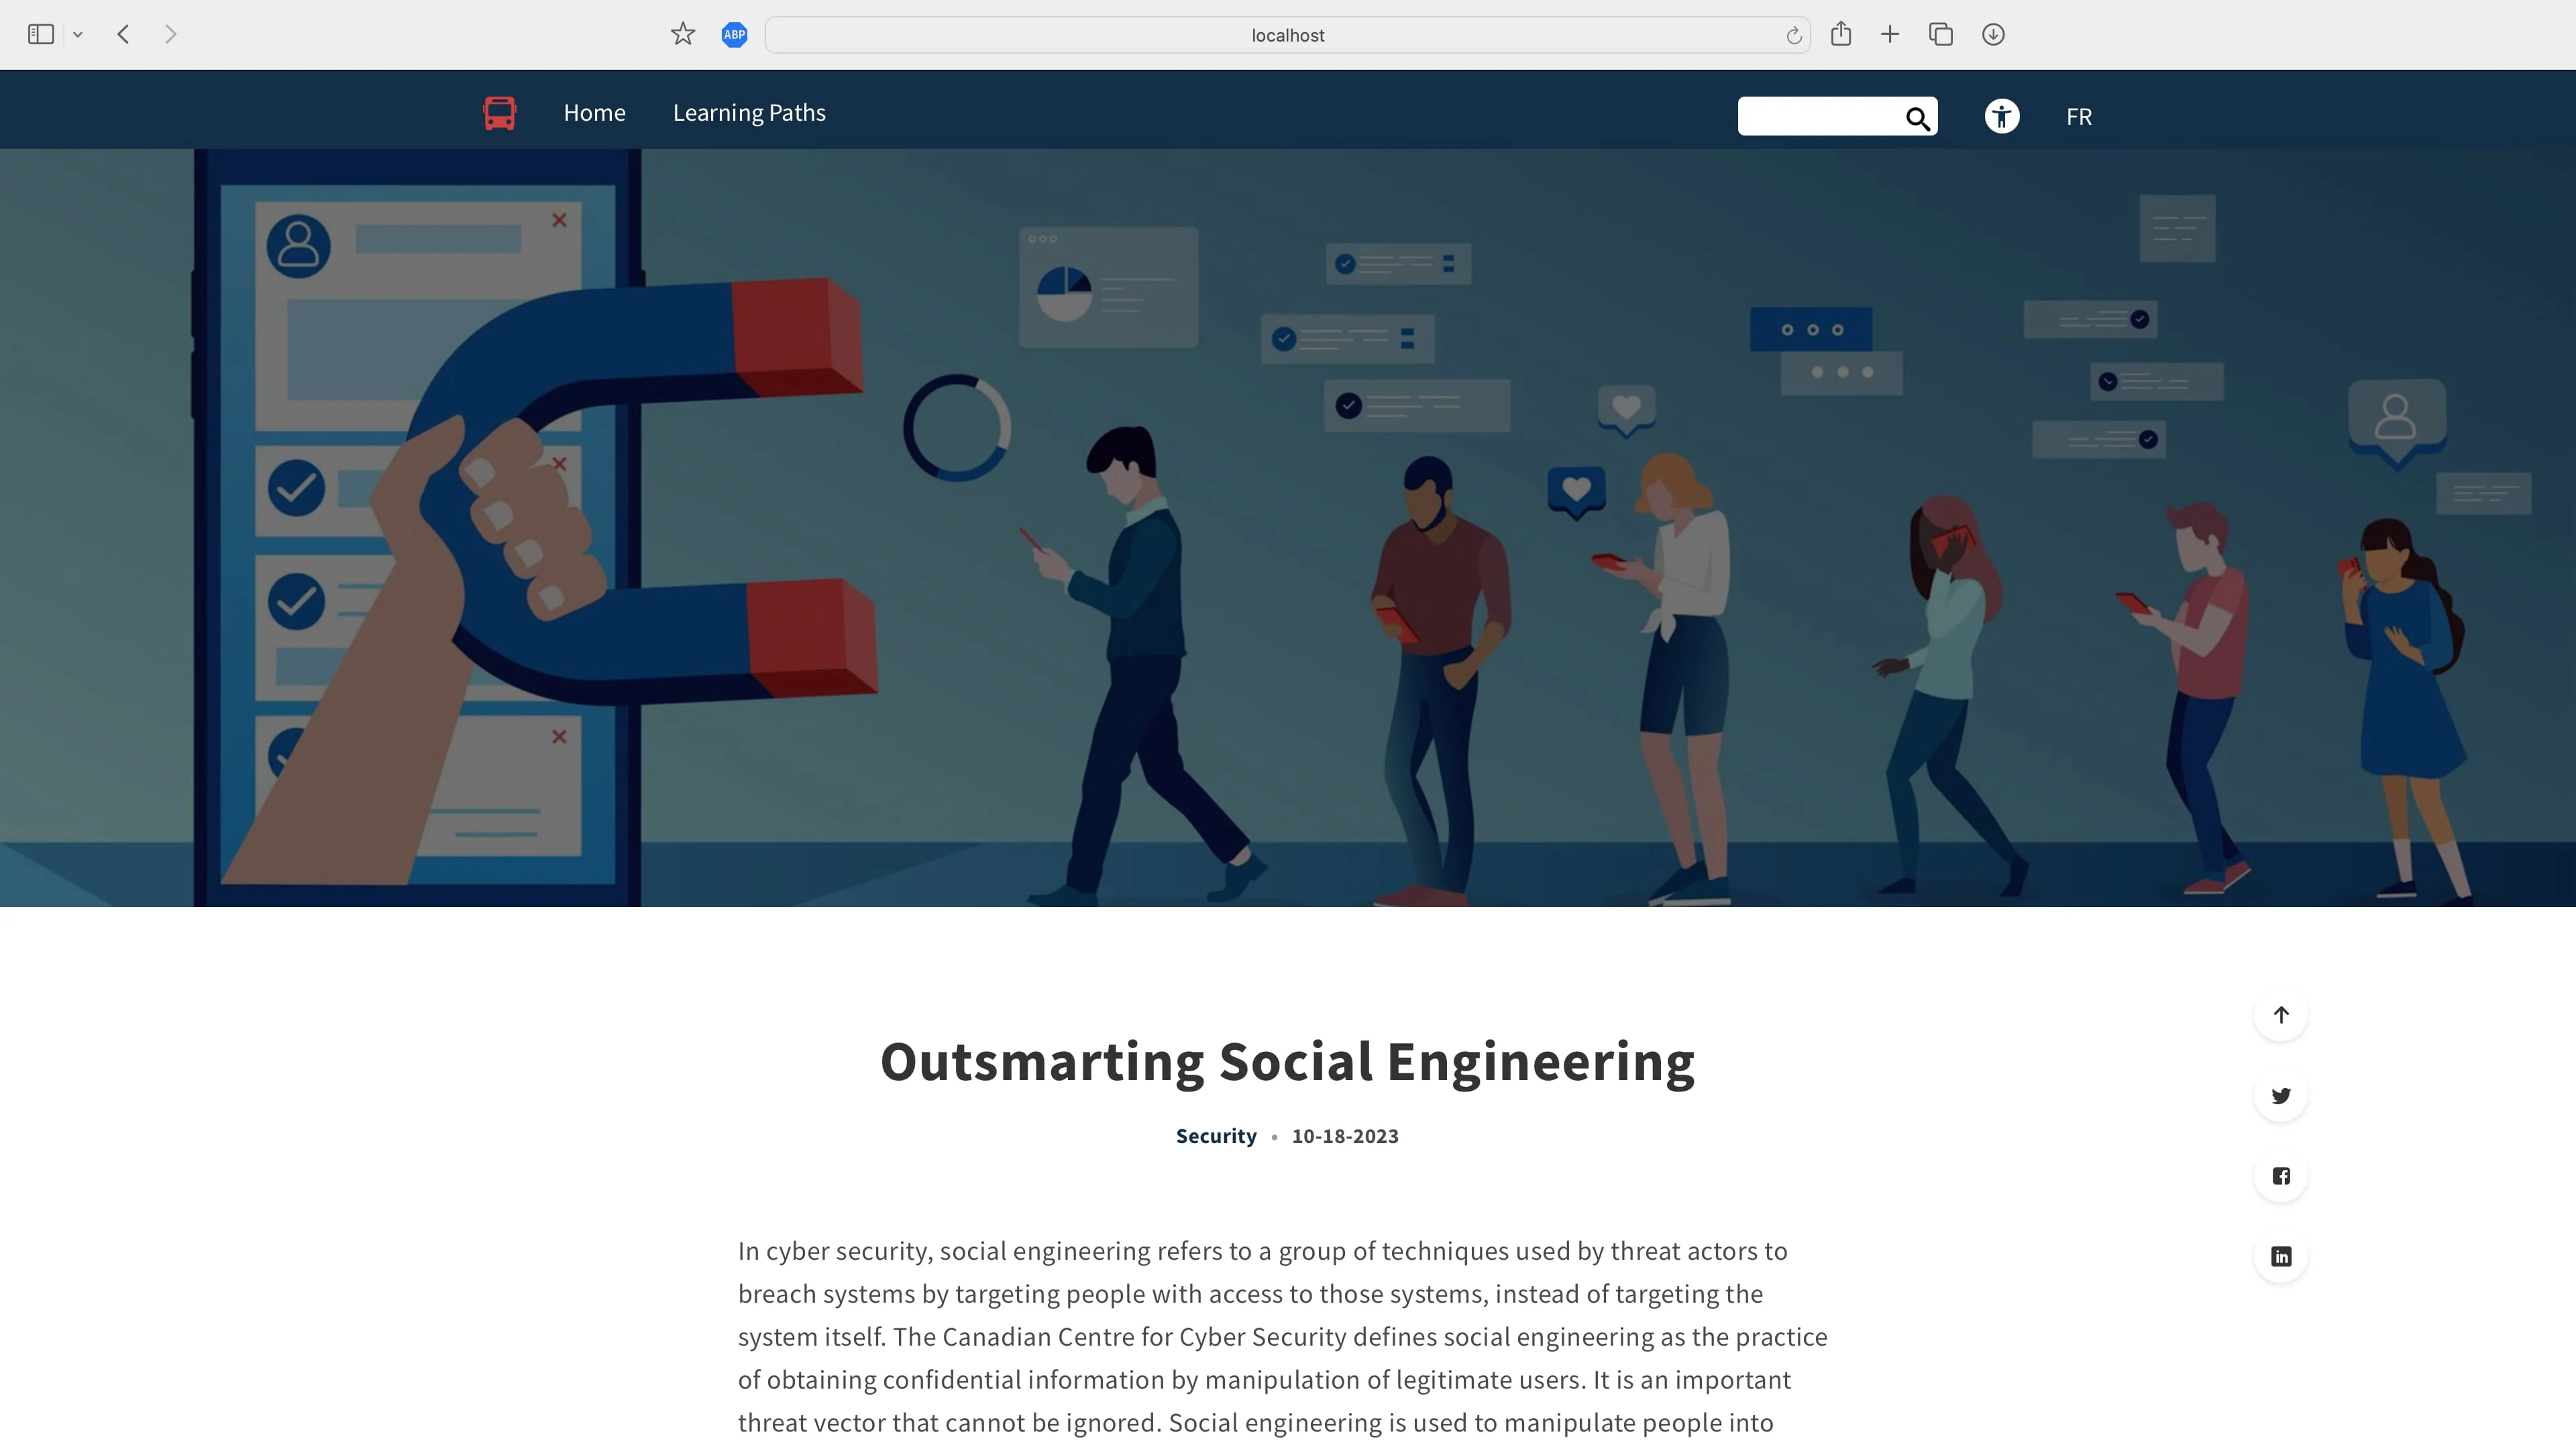
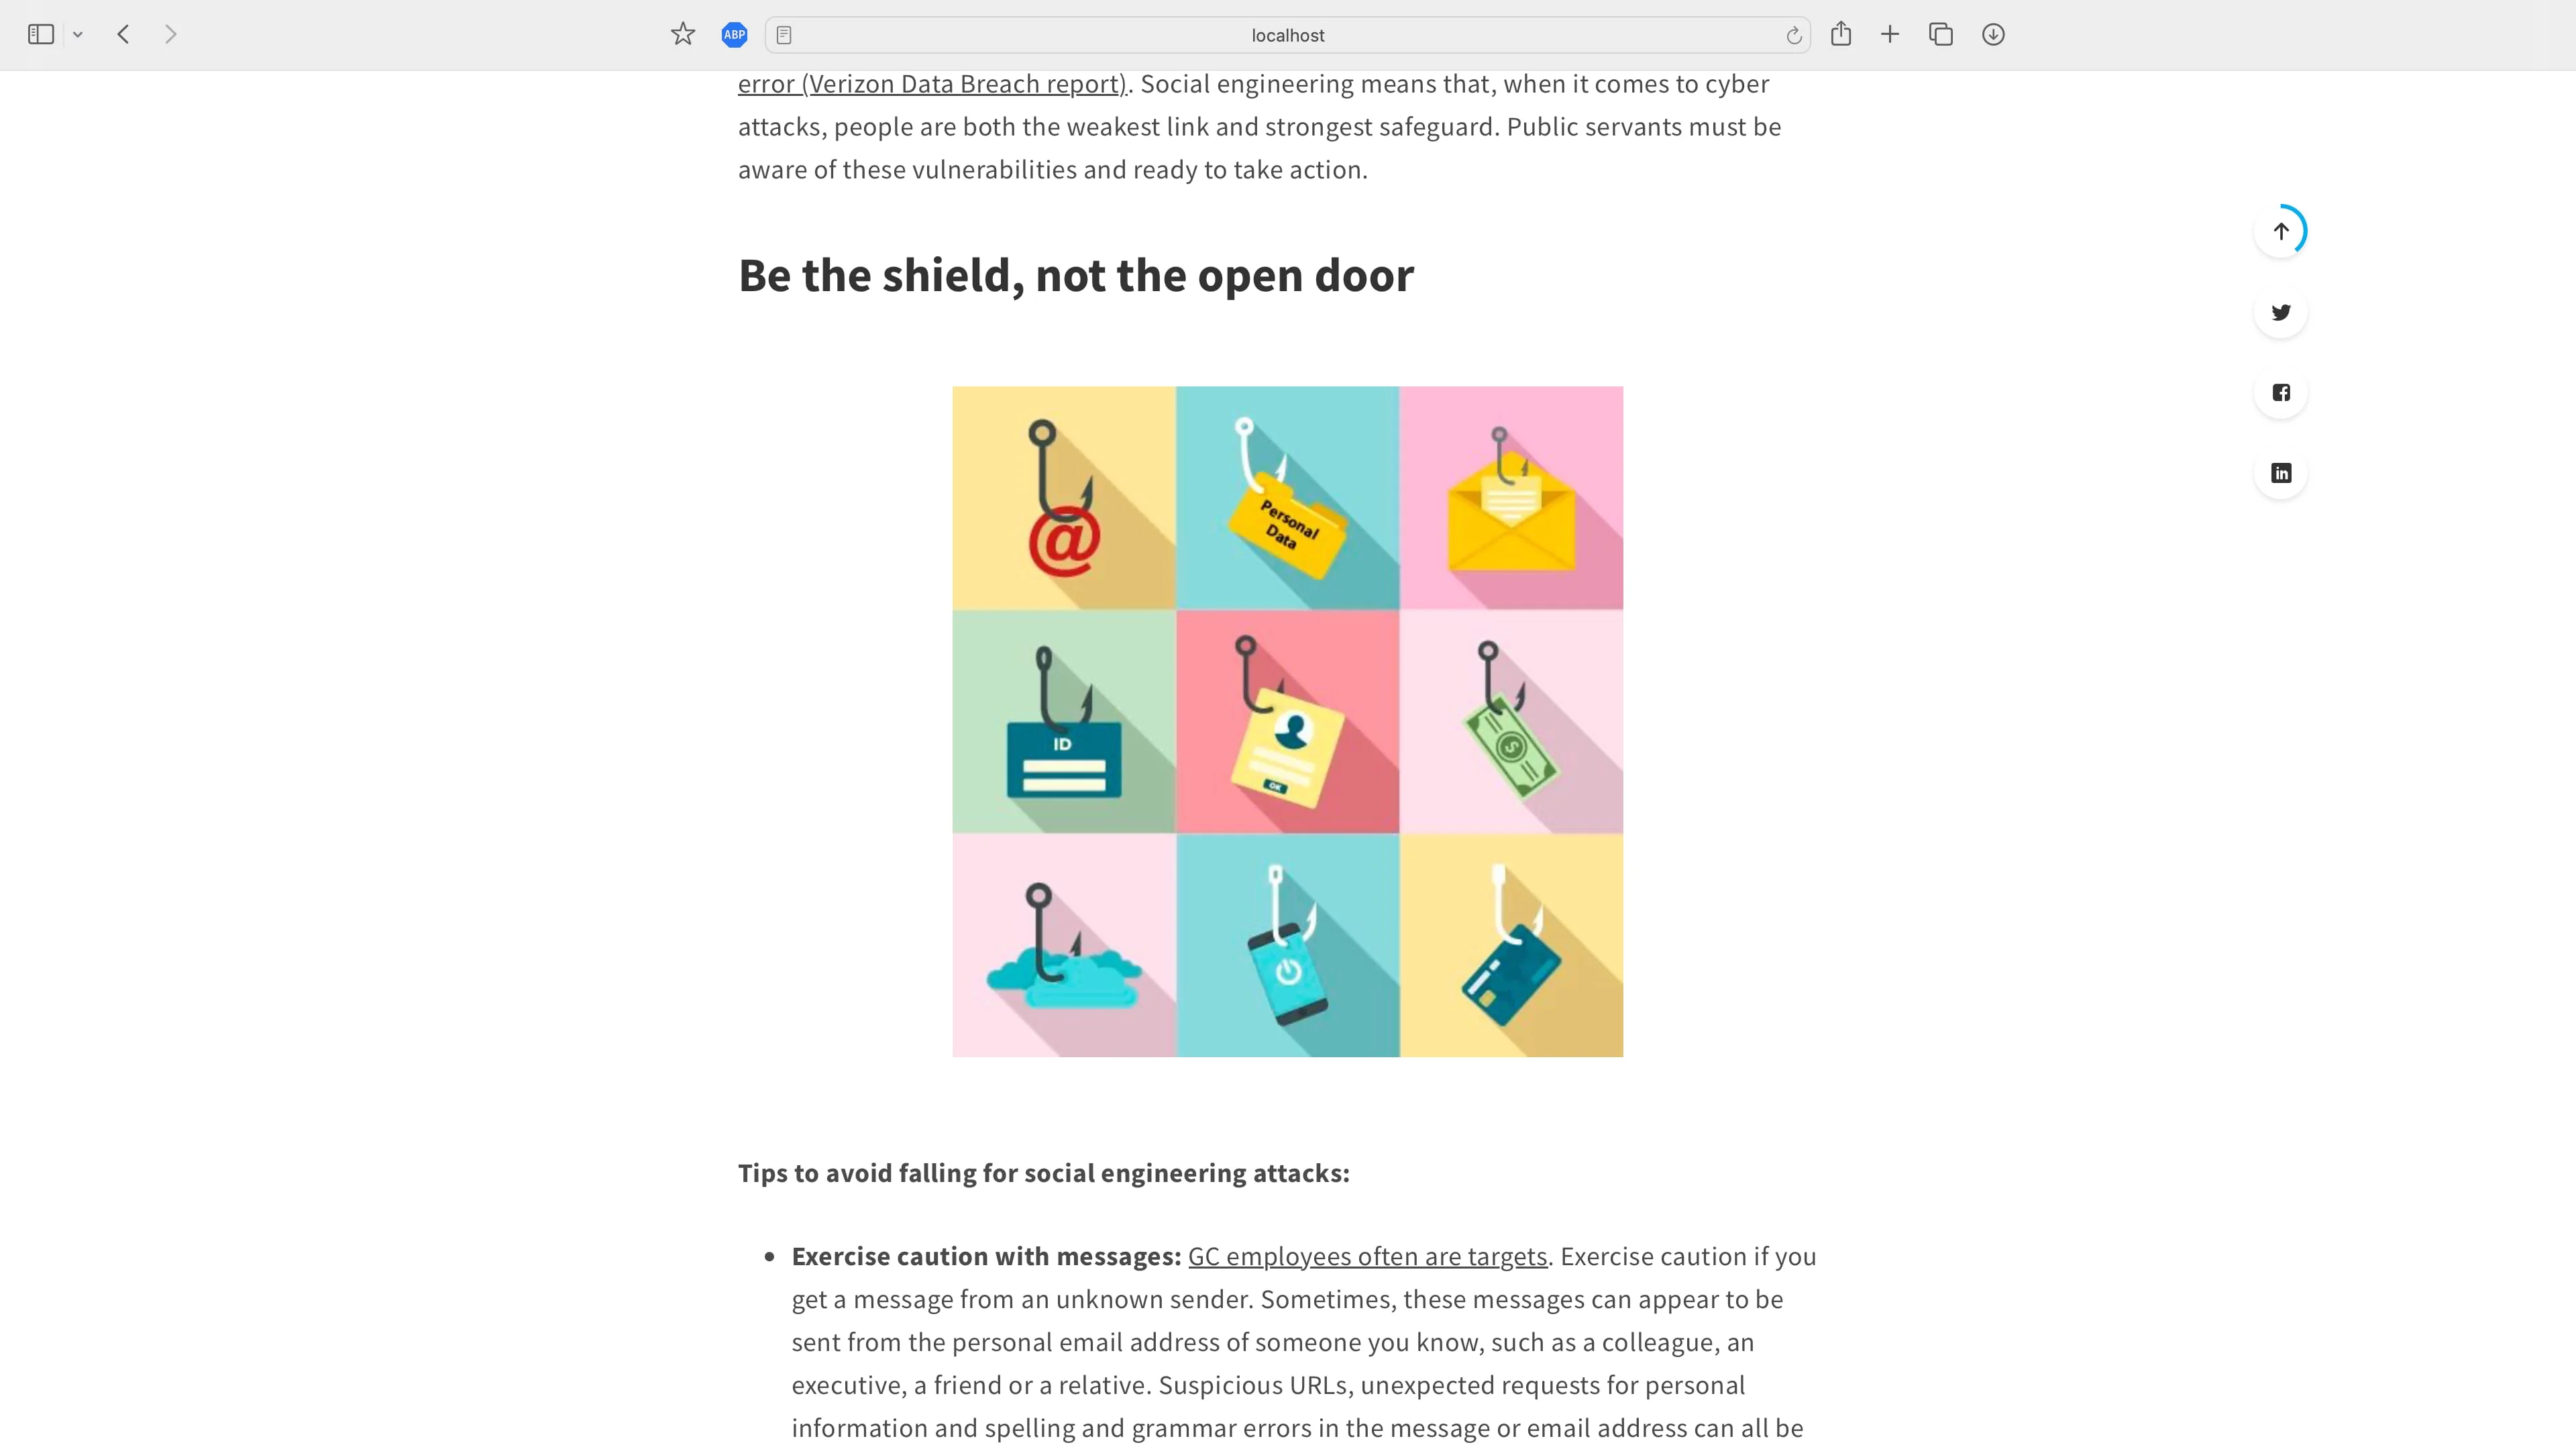
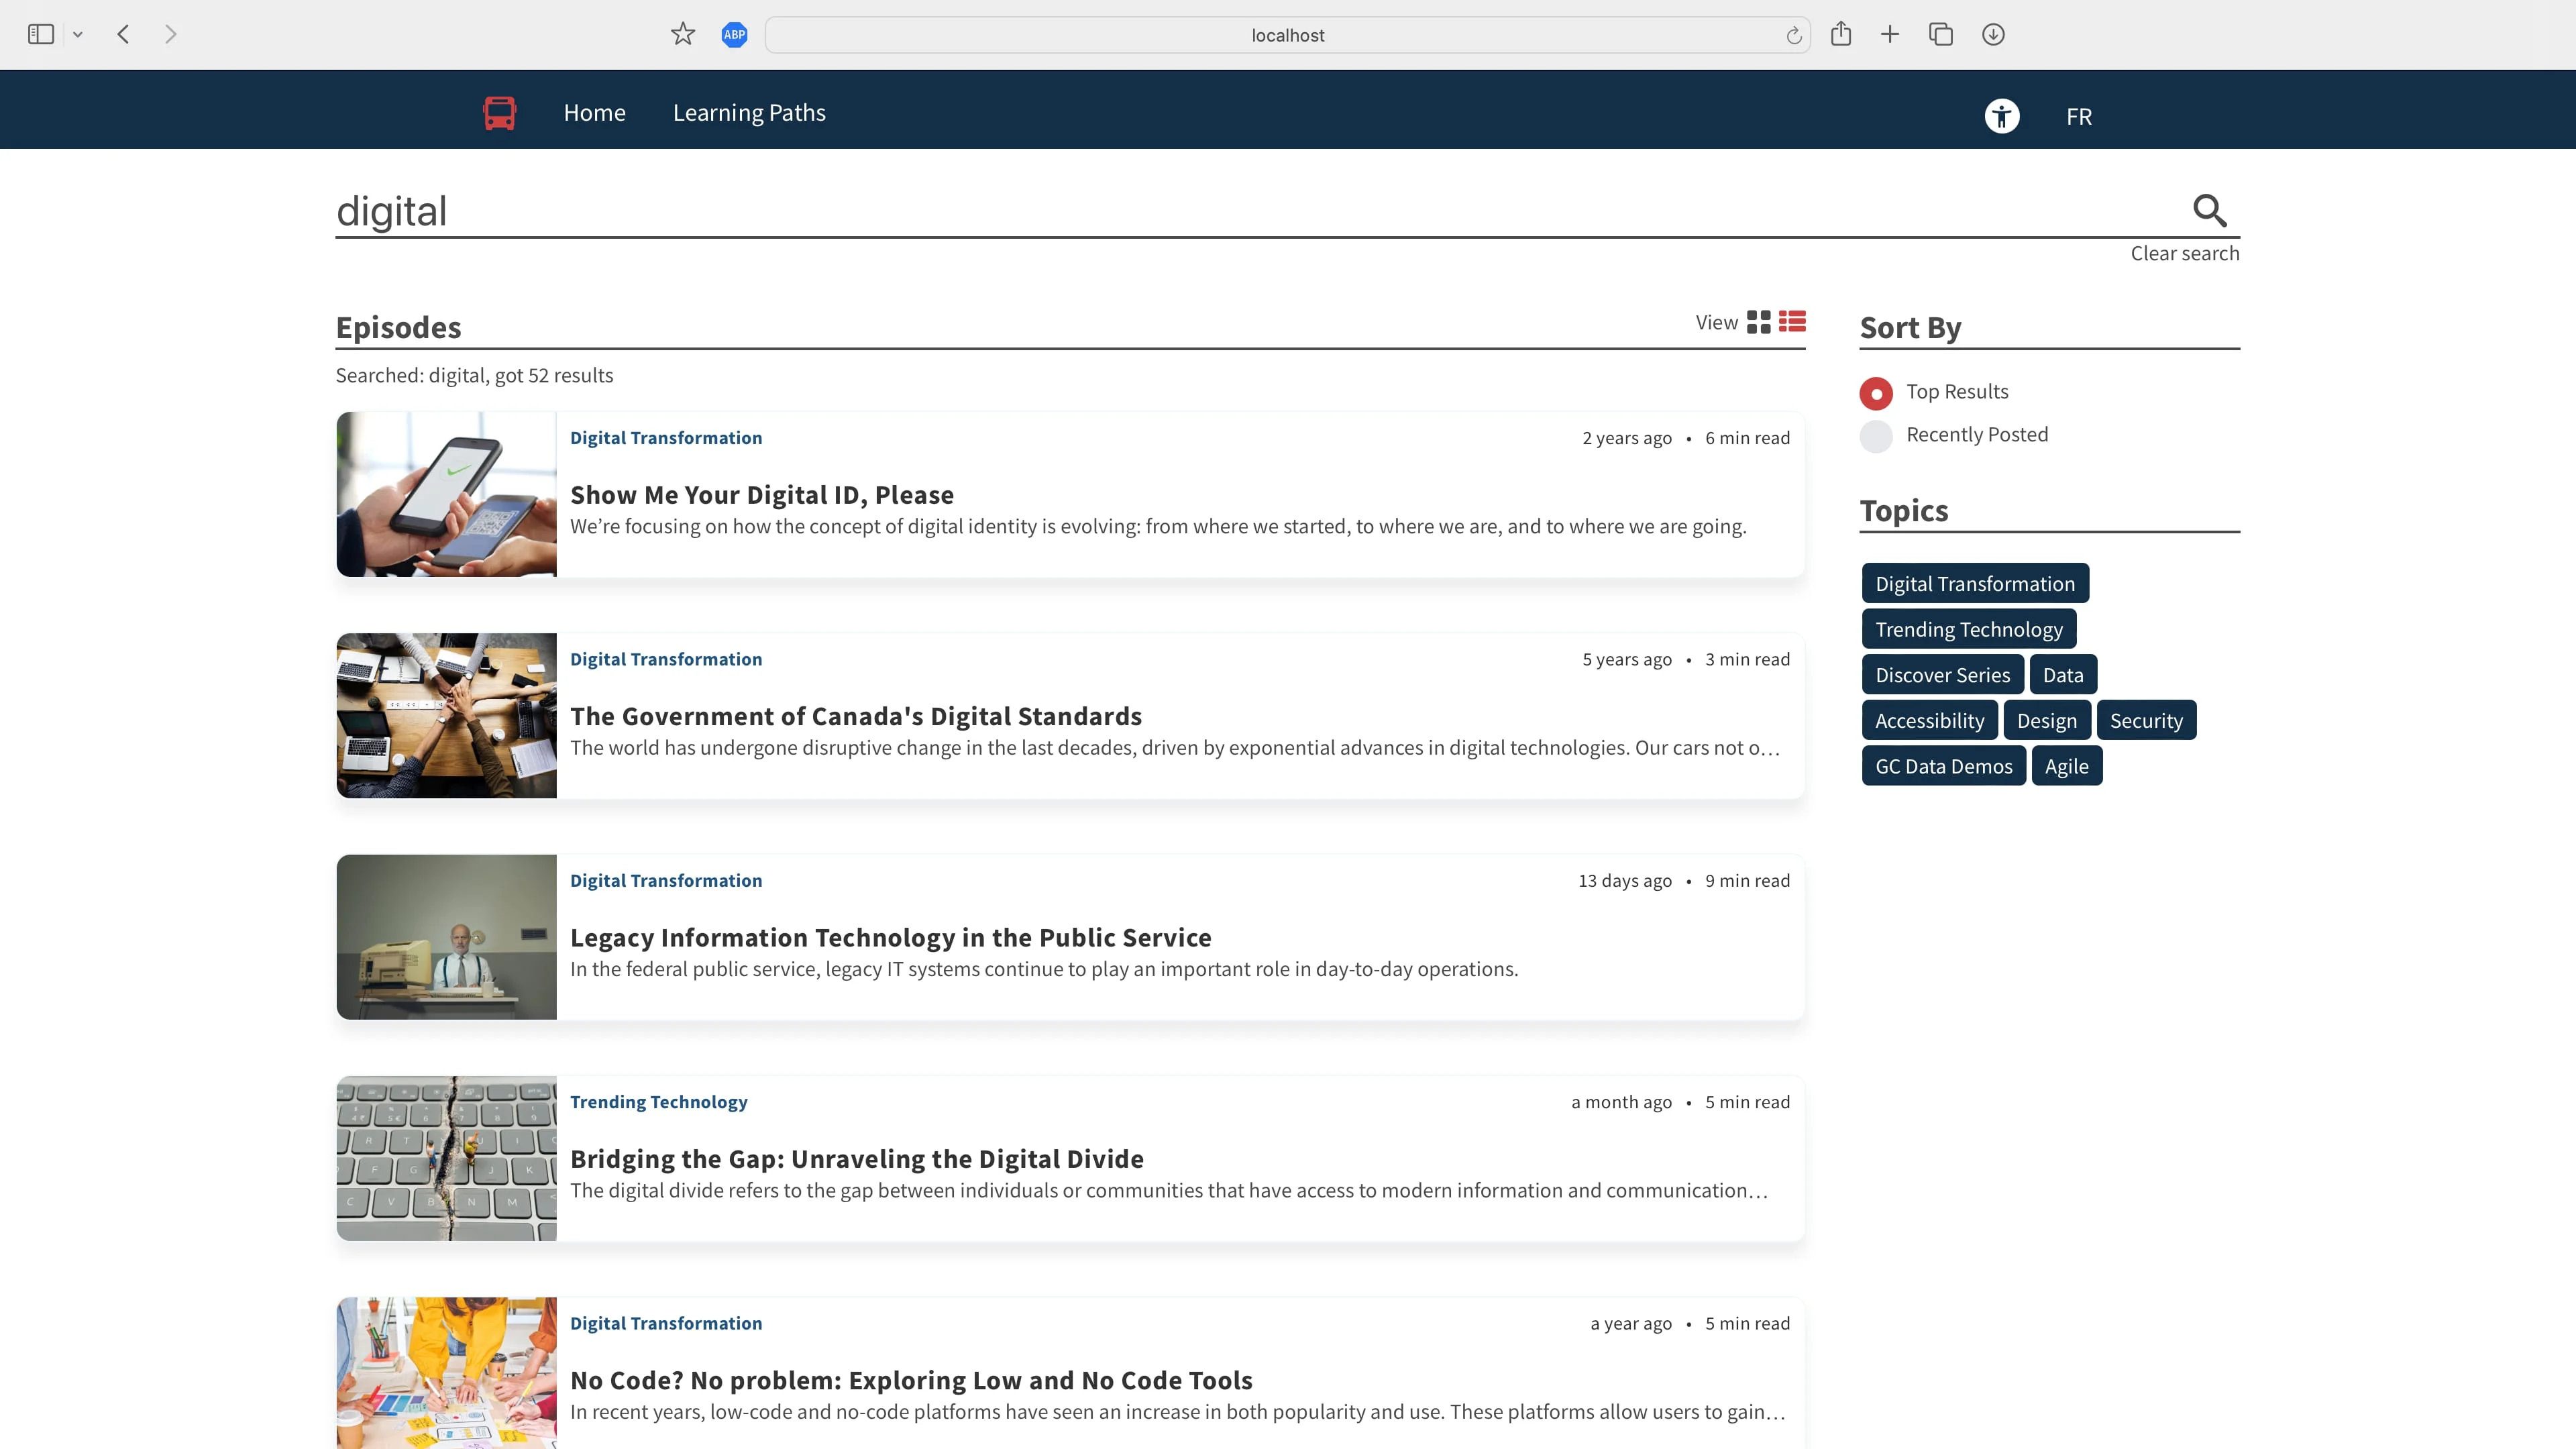
As the lead developer and designer, I transformed Busrides into a dynamic micro-learning platform with a name inspired by those fleeting moments on a bus ride to work when one can acquire new knowledge. Originally a modest WordPress site with a handful of users, I embarked on a comprehensive redesign, exploring alternative headless CMS options, and ultimately rebuilding the platform using Next.js and Ghost CMS. Along the way, I introduced engaging events, including an advent calendar filled with daily data insights and an interactive Easter egg hunt that led users across the site. Thanks to these enhancements and the platform's new design, Busrides experienced remarkable growth, attracting over 10,000 users monthly. Recognized for my technical and communication skills, I was offered a full-time, indeterminate position, where I not only met with business owners to translate objectives into code but also excelled in writing clear and accessible documentation, earning praise from non-technical team members. Busrides has evolved into a thriving hub for learning, made possible by this transformative journey.
 Next.js
 React
React Node.js
 JavaScript
 HTML
HTML CSS
CSS Adobe XD
 Adobe Photoshop
- React Native
 Google Analytics
 Amazon Web Services
 Microsoft Azure
 Ghost CMS

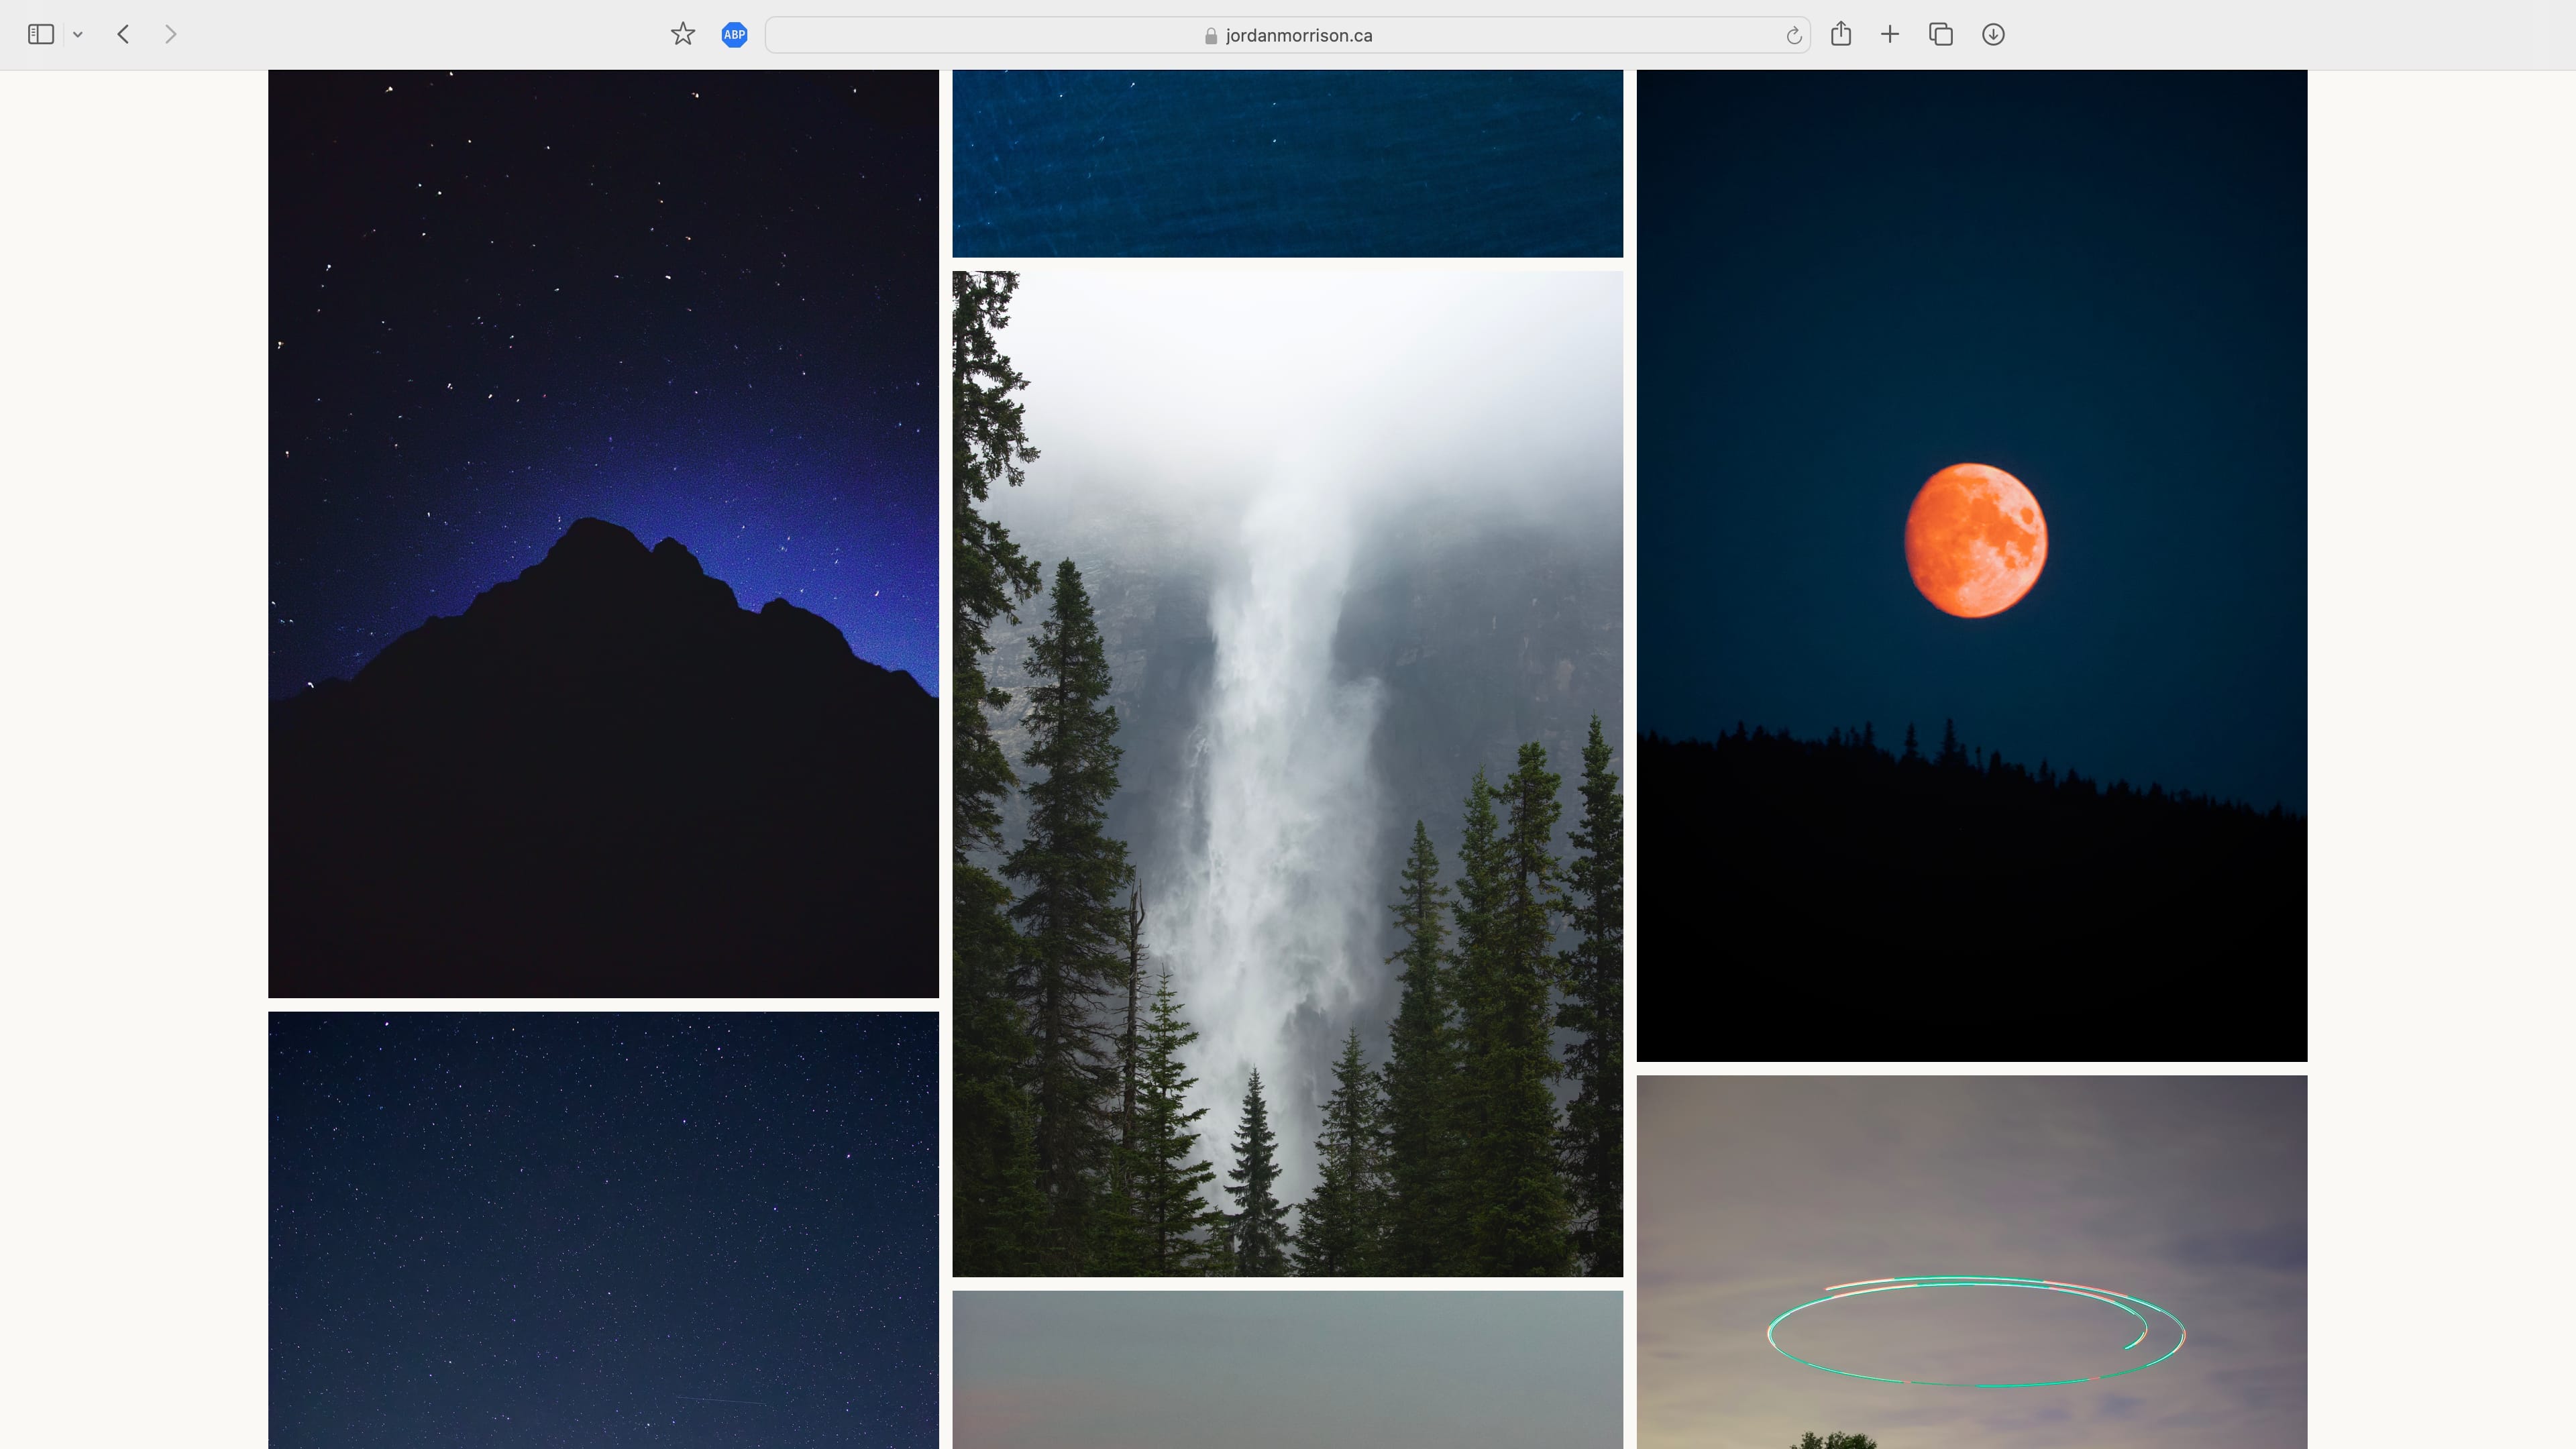
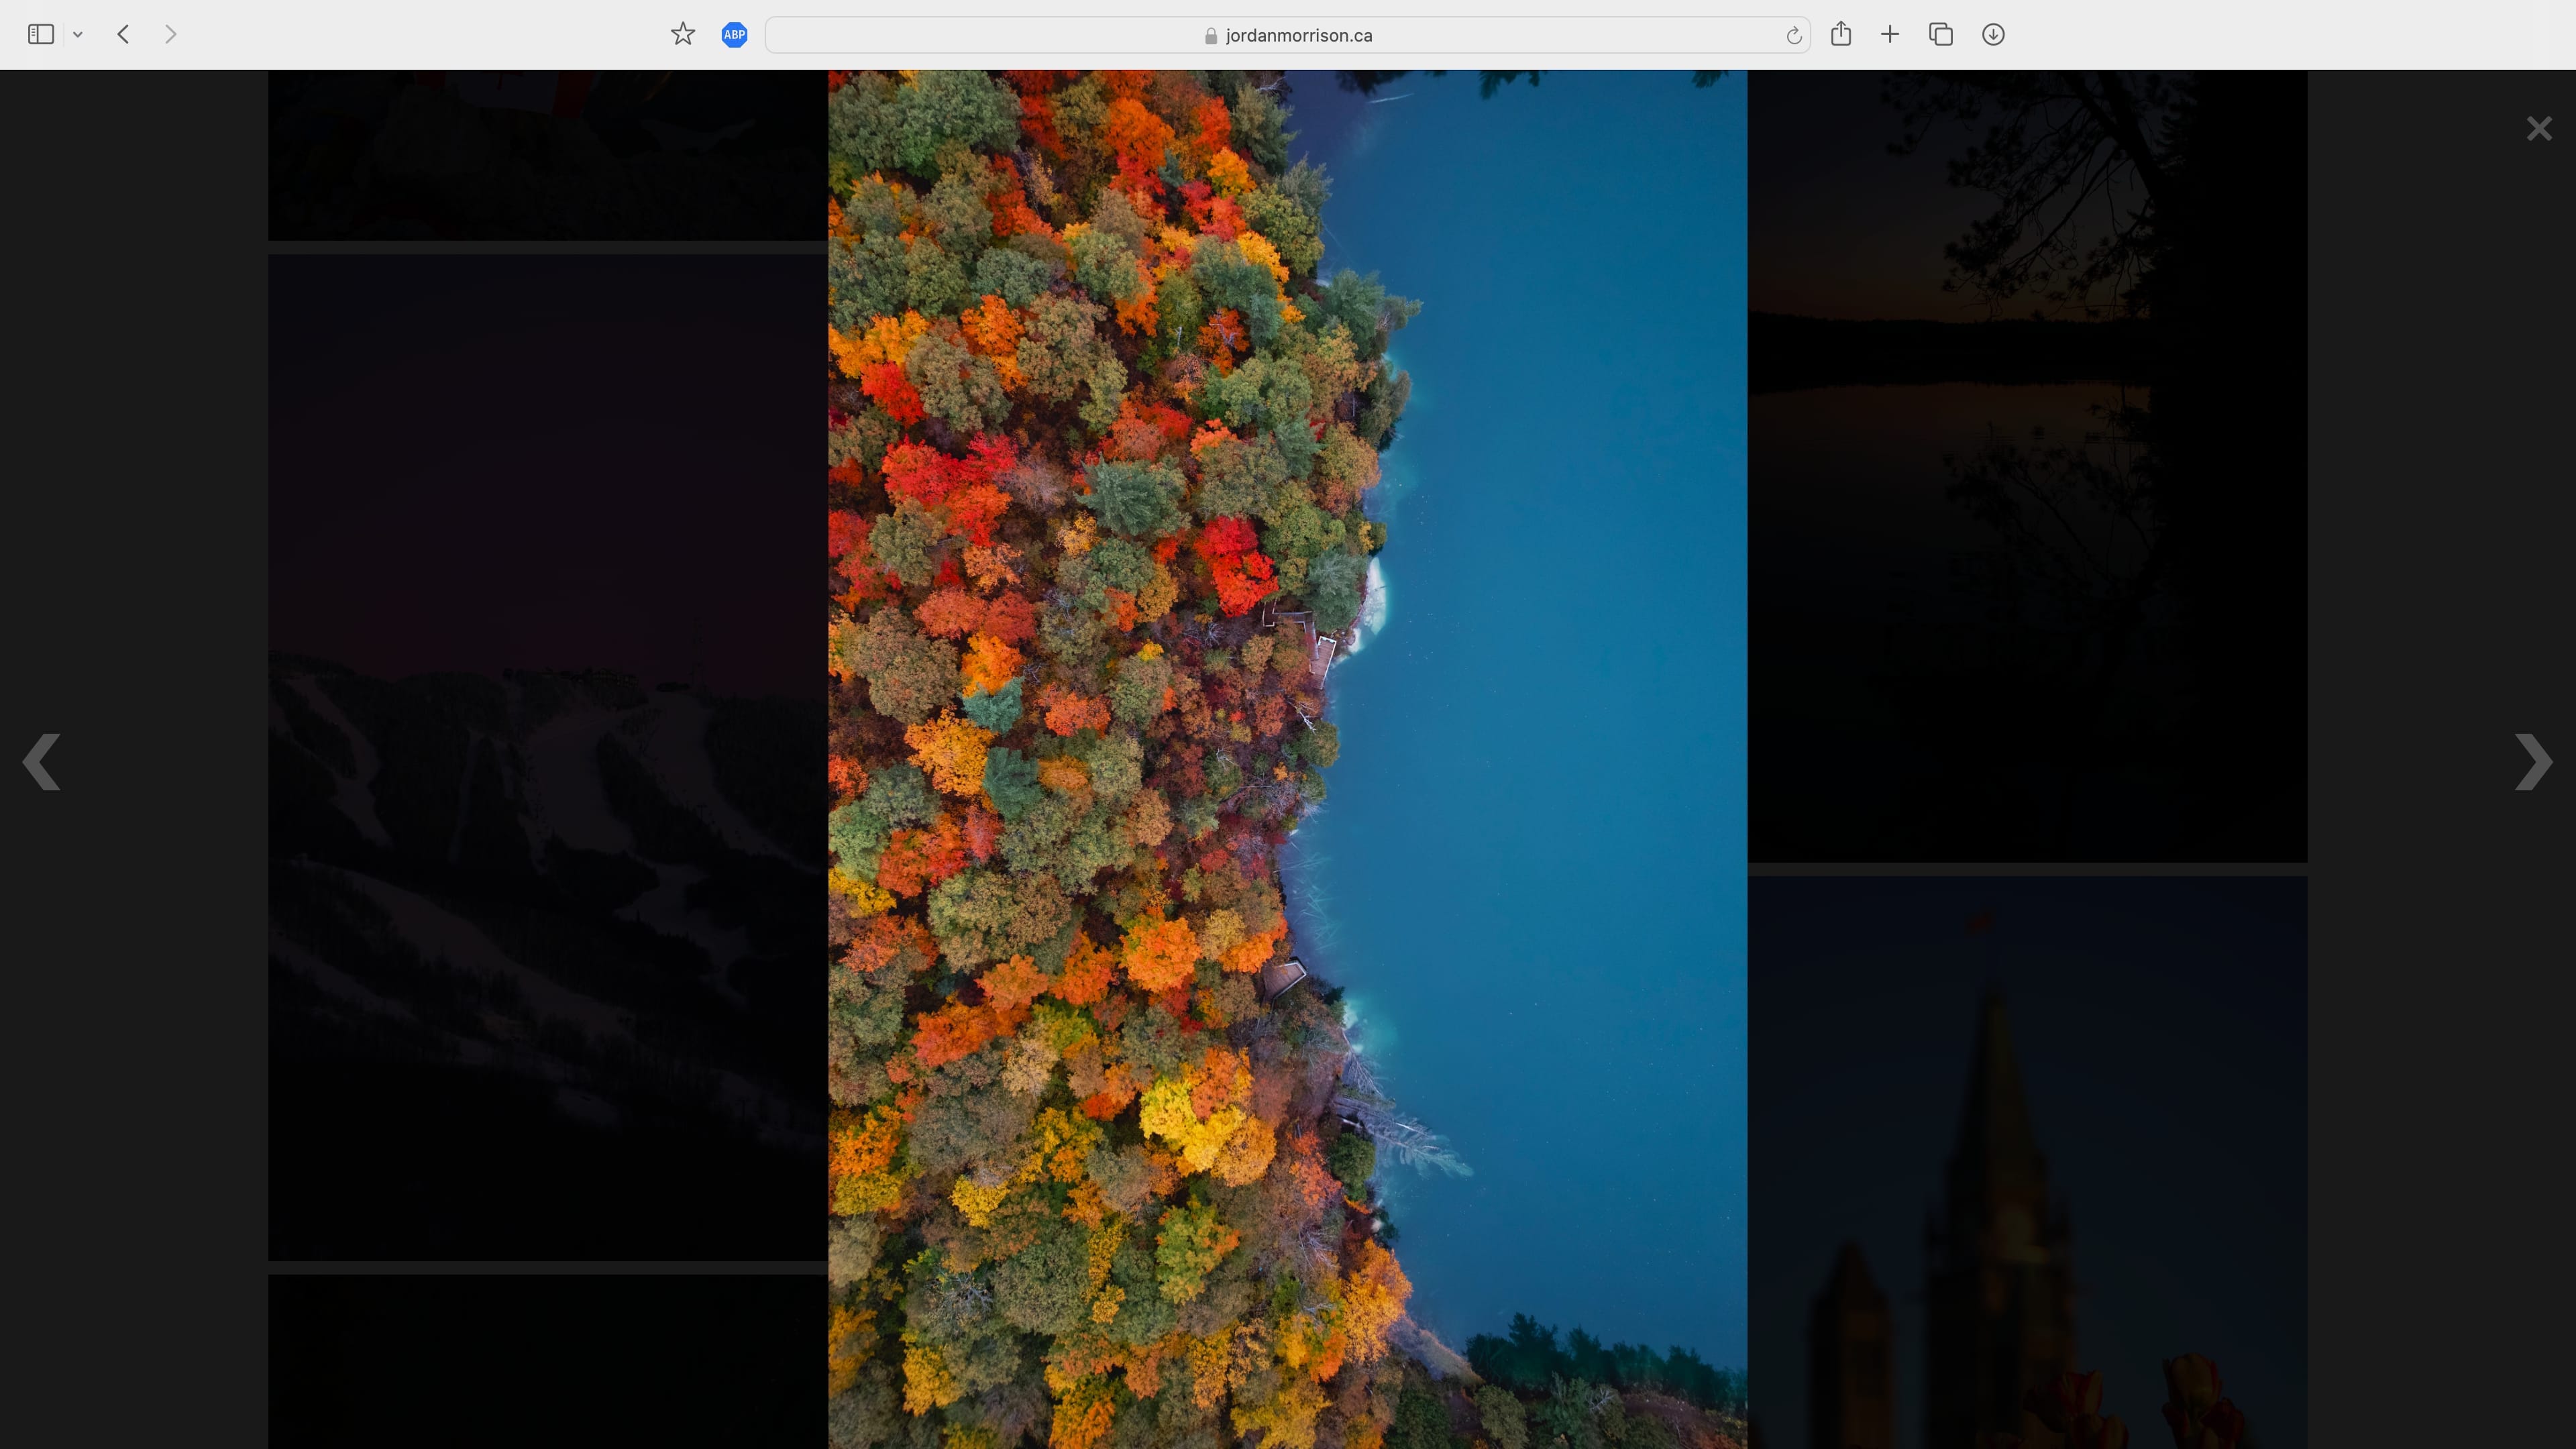
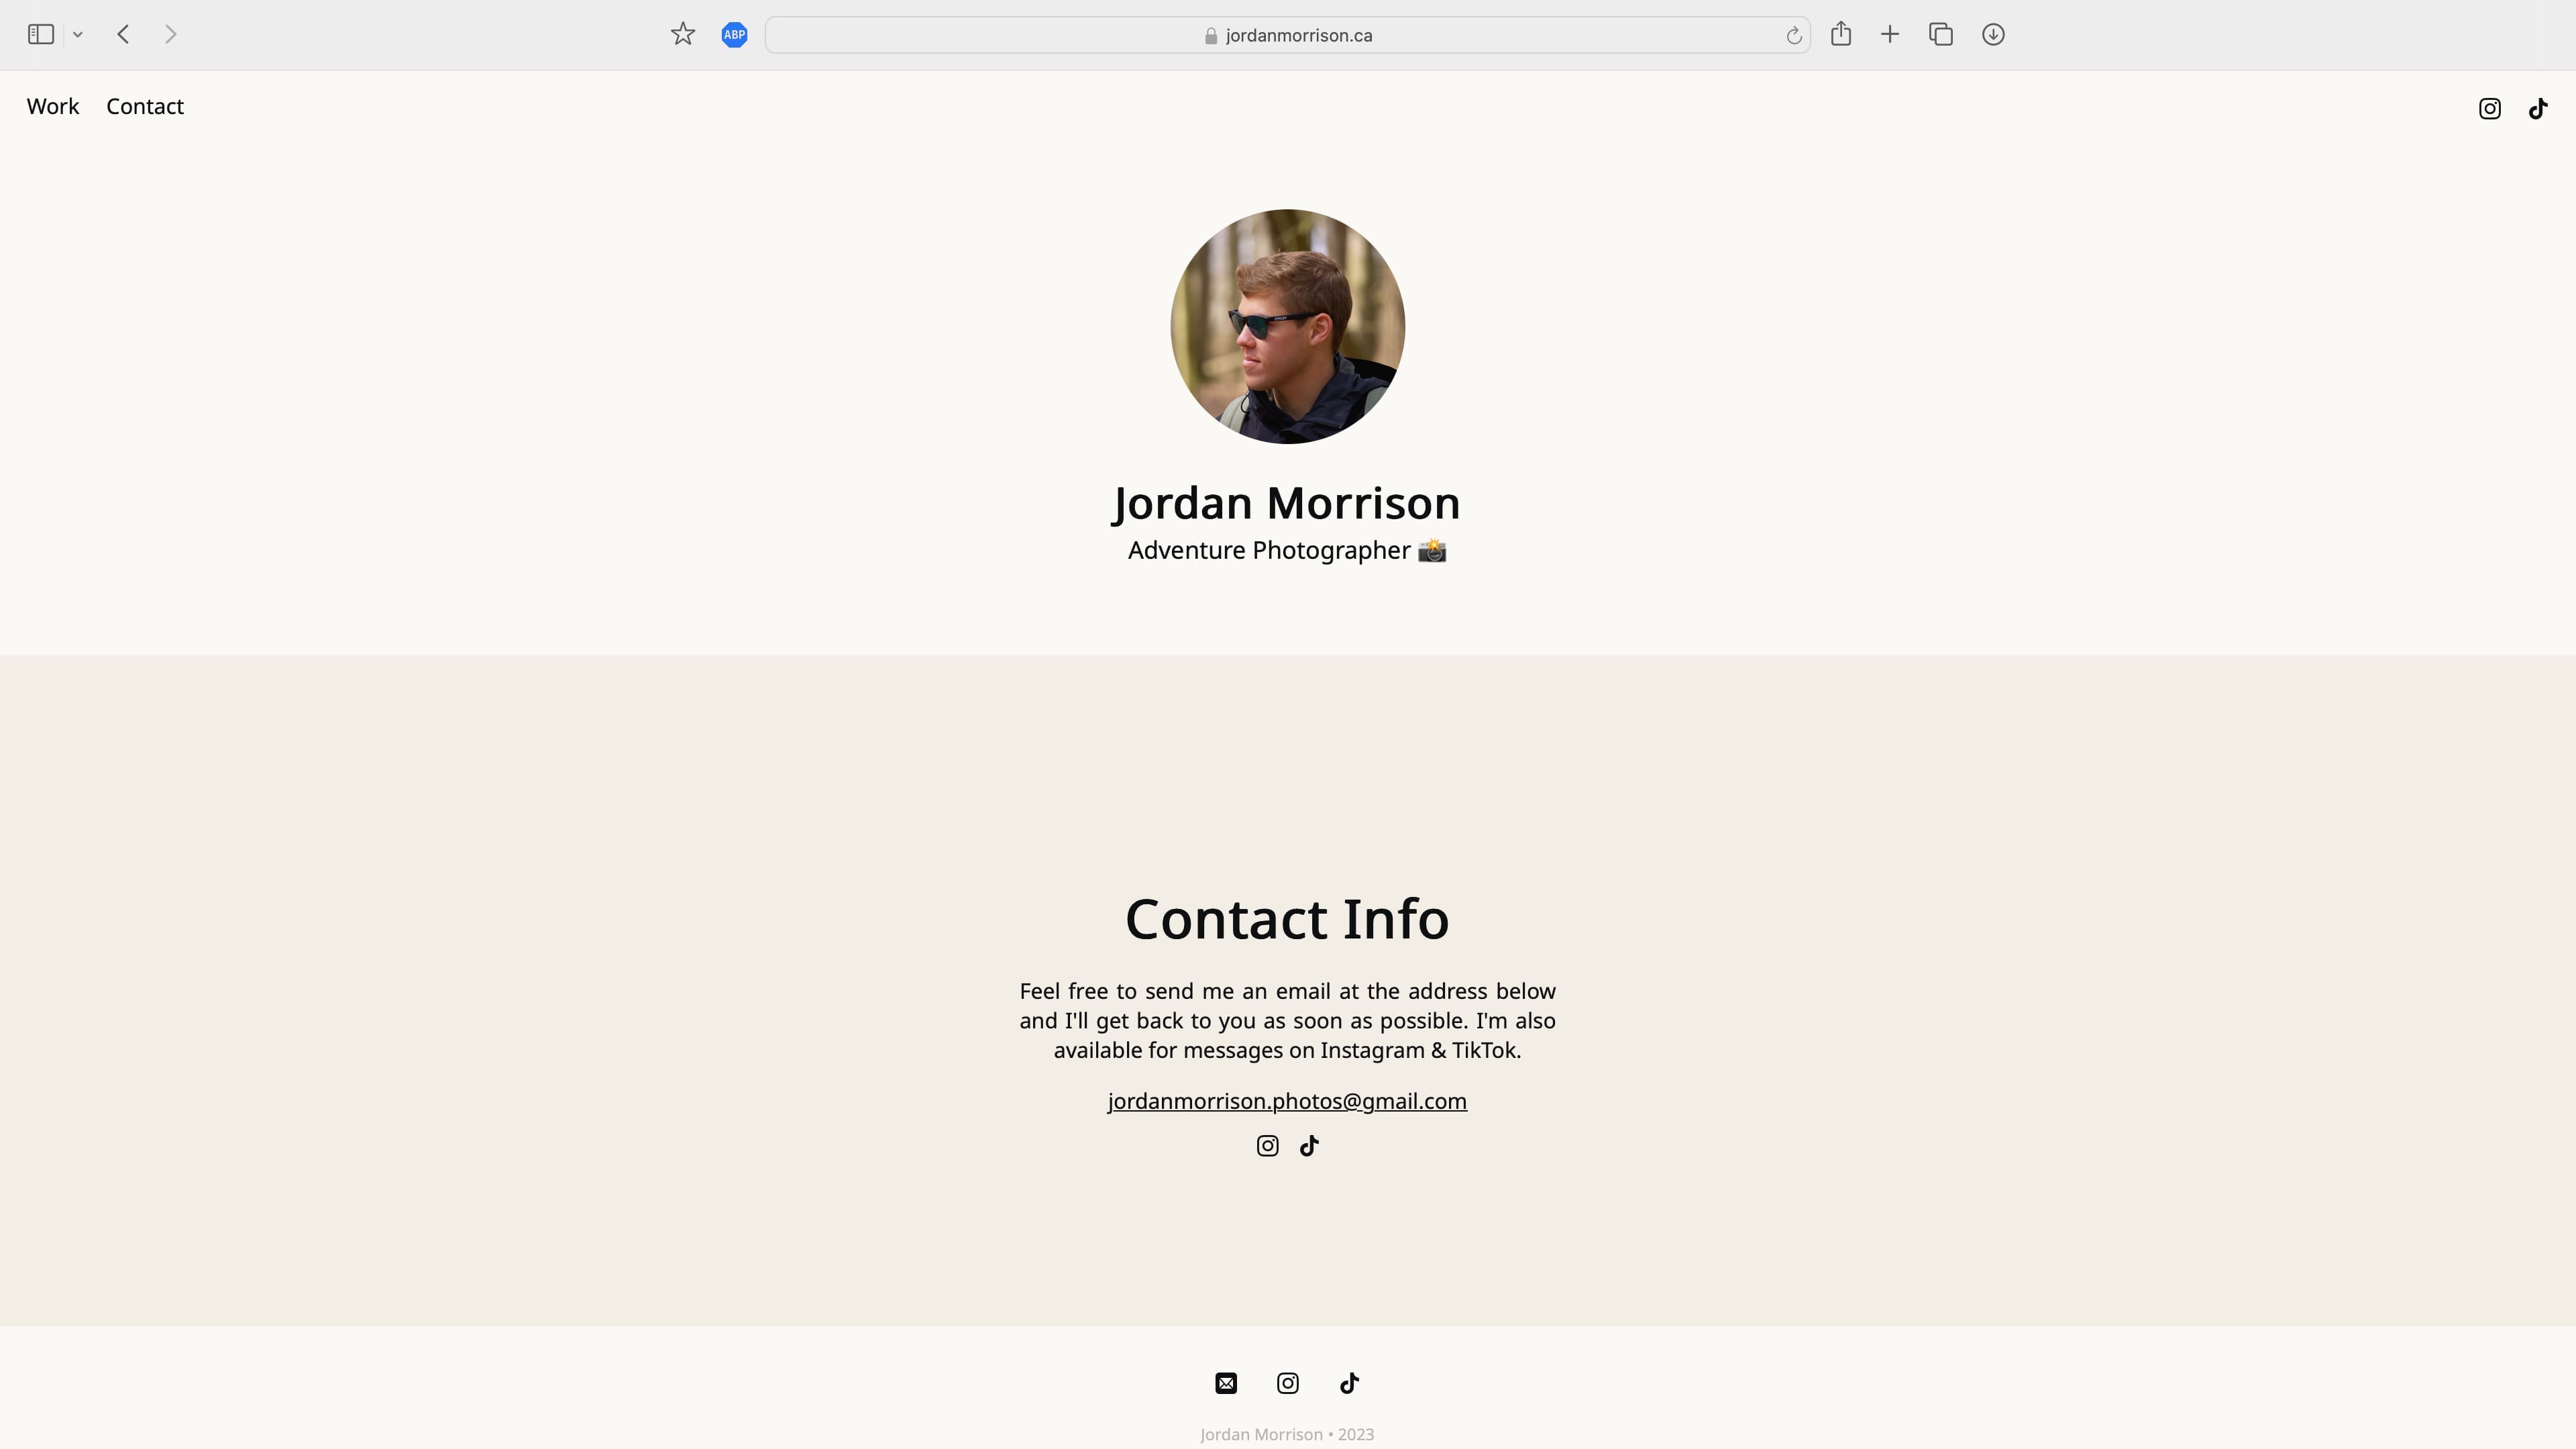
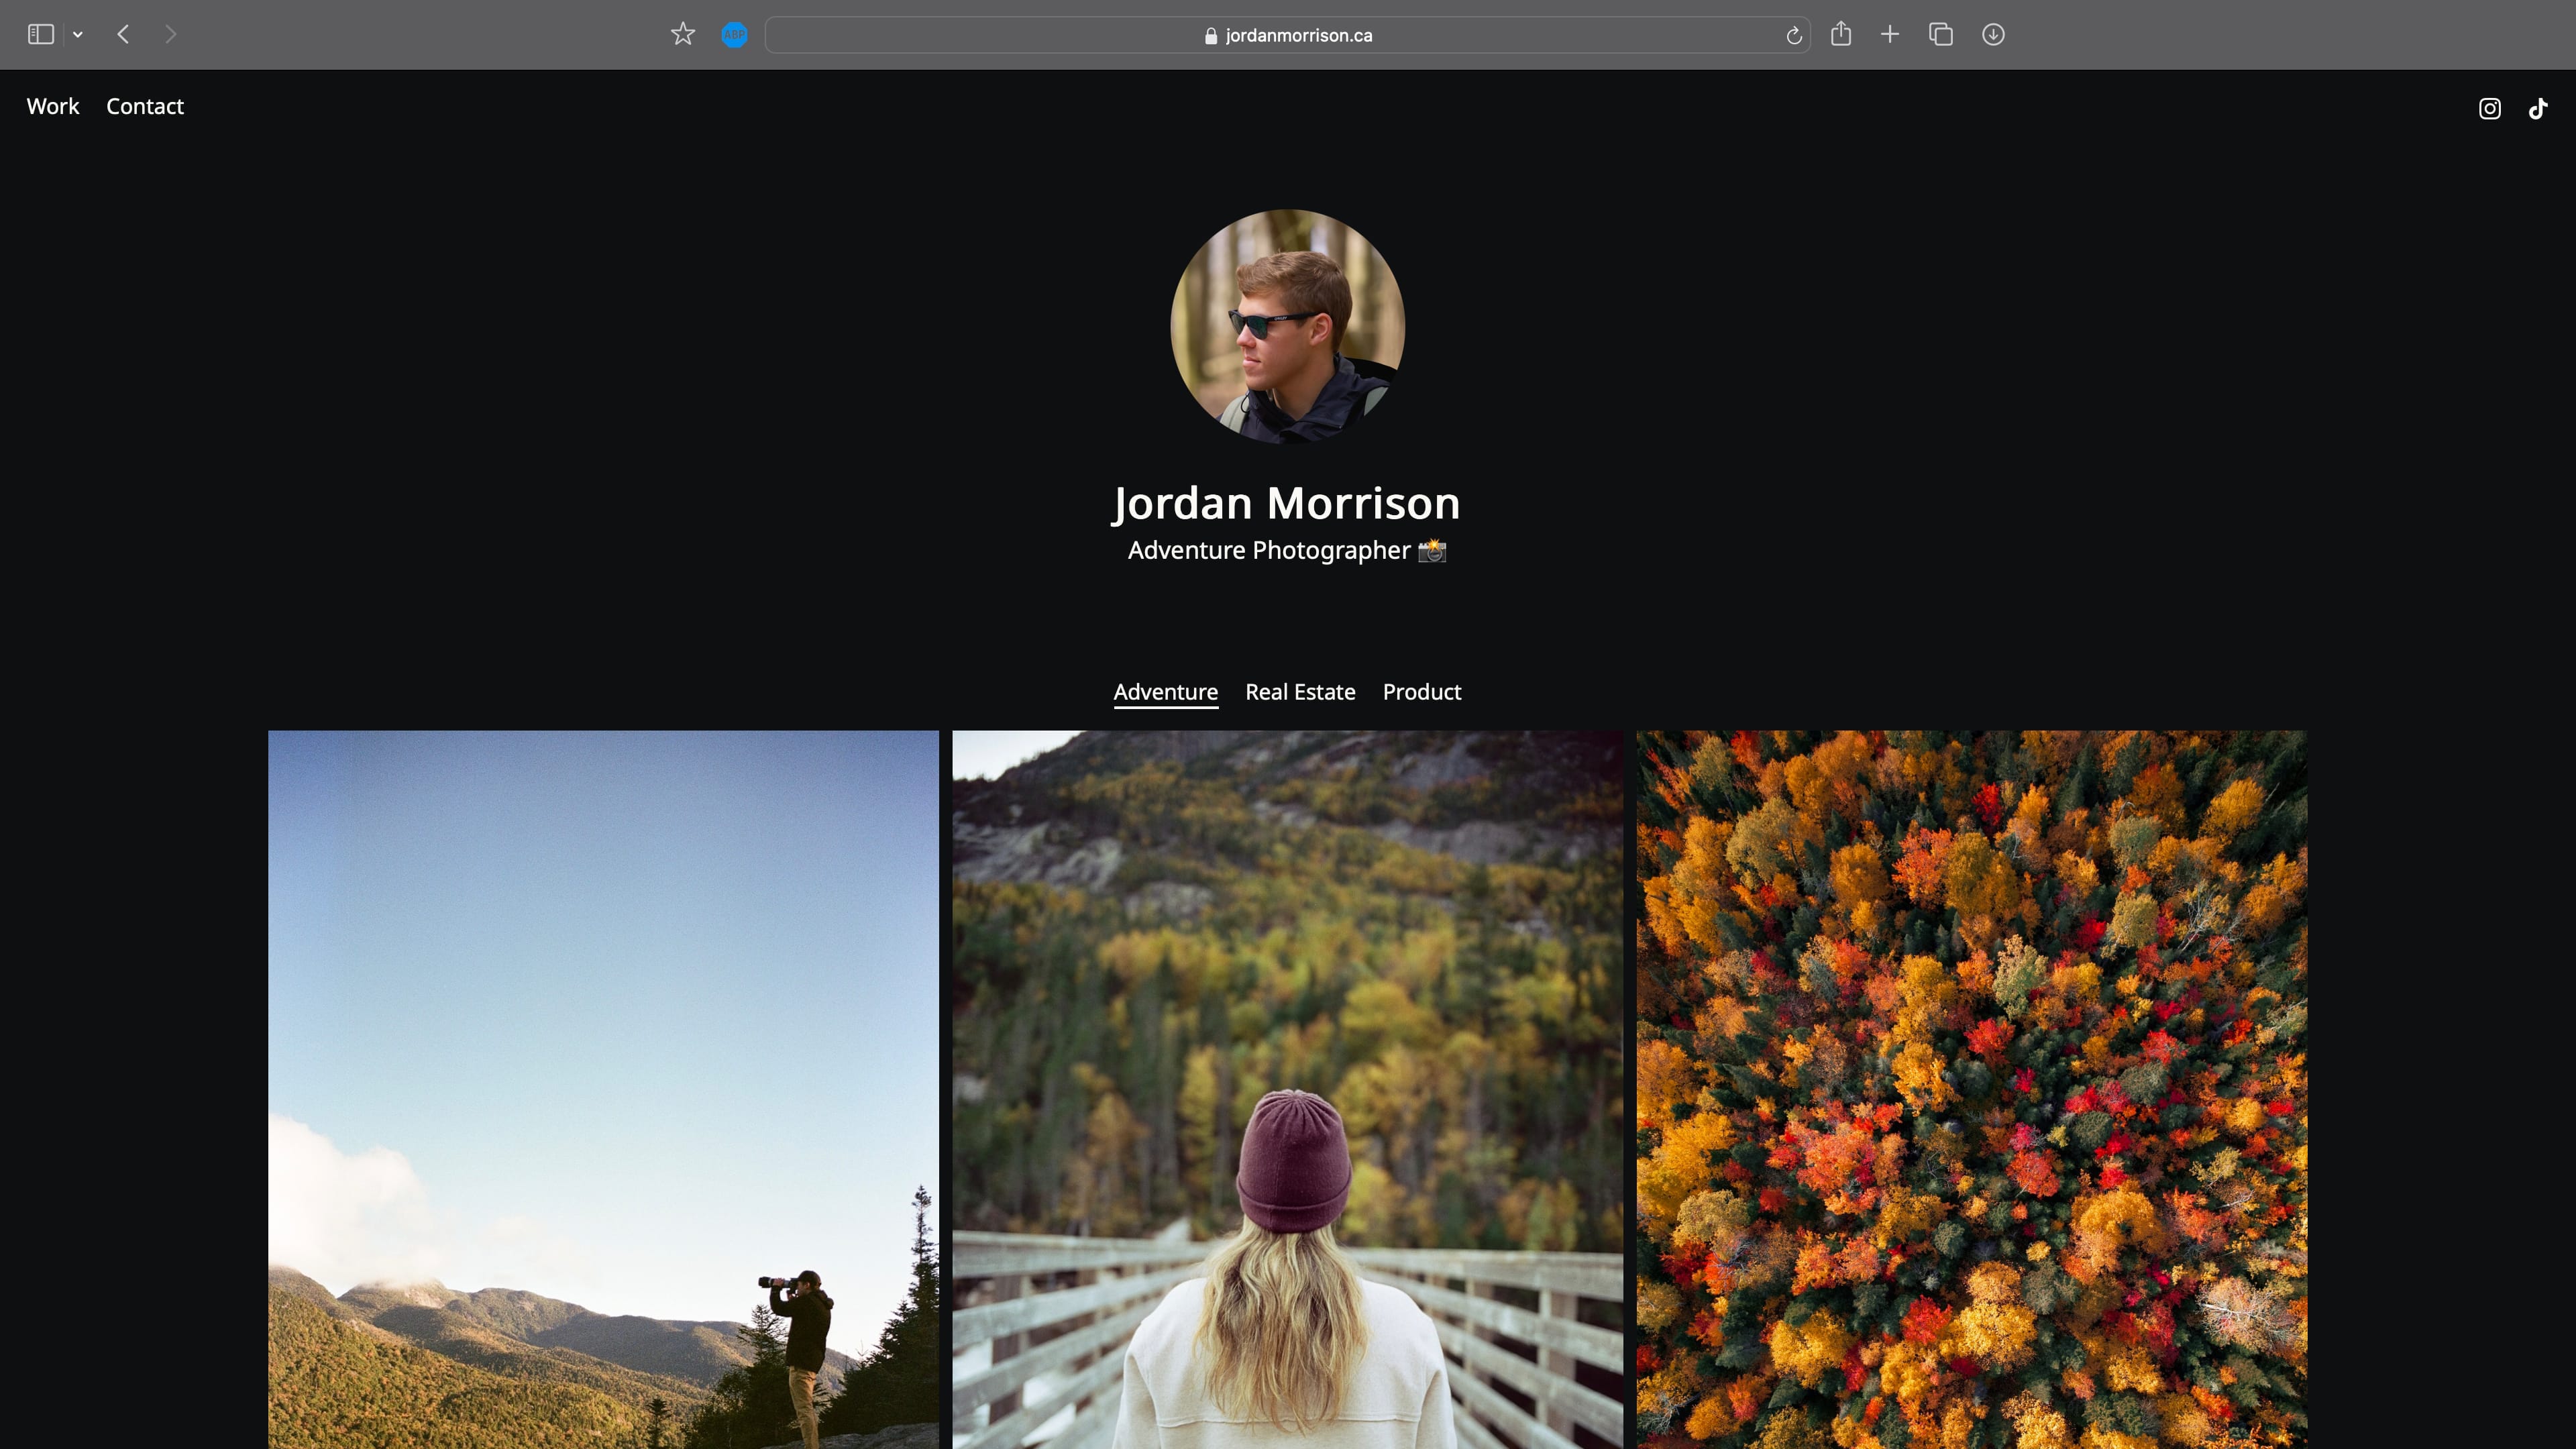
Photography Portfolio
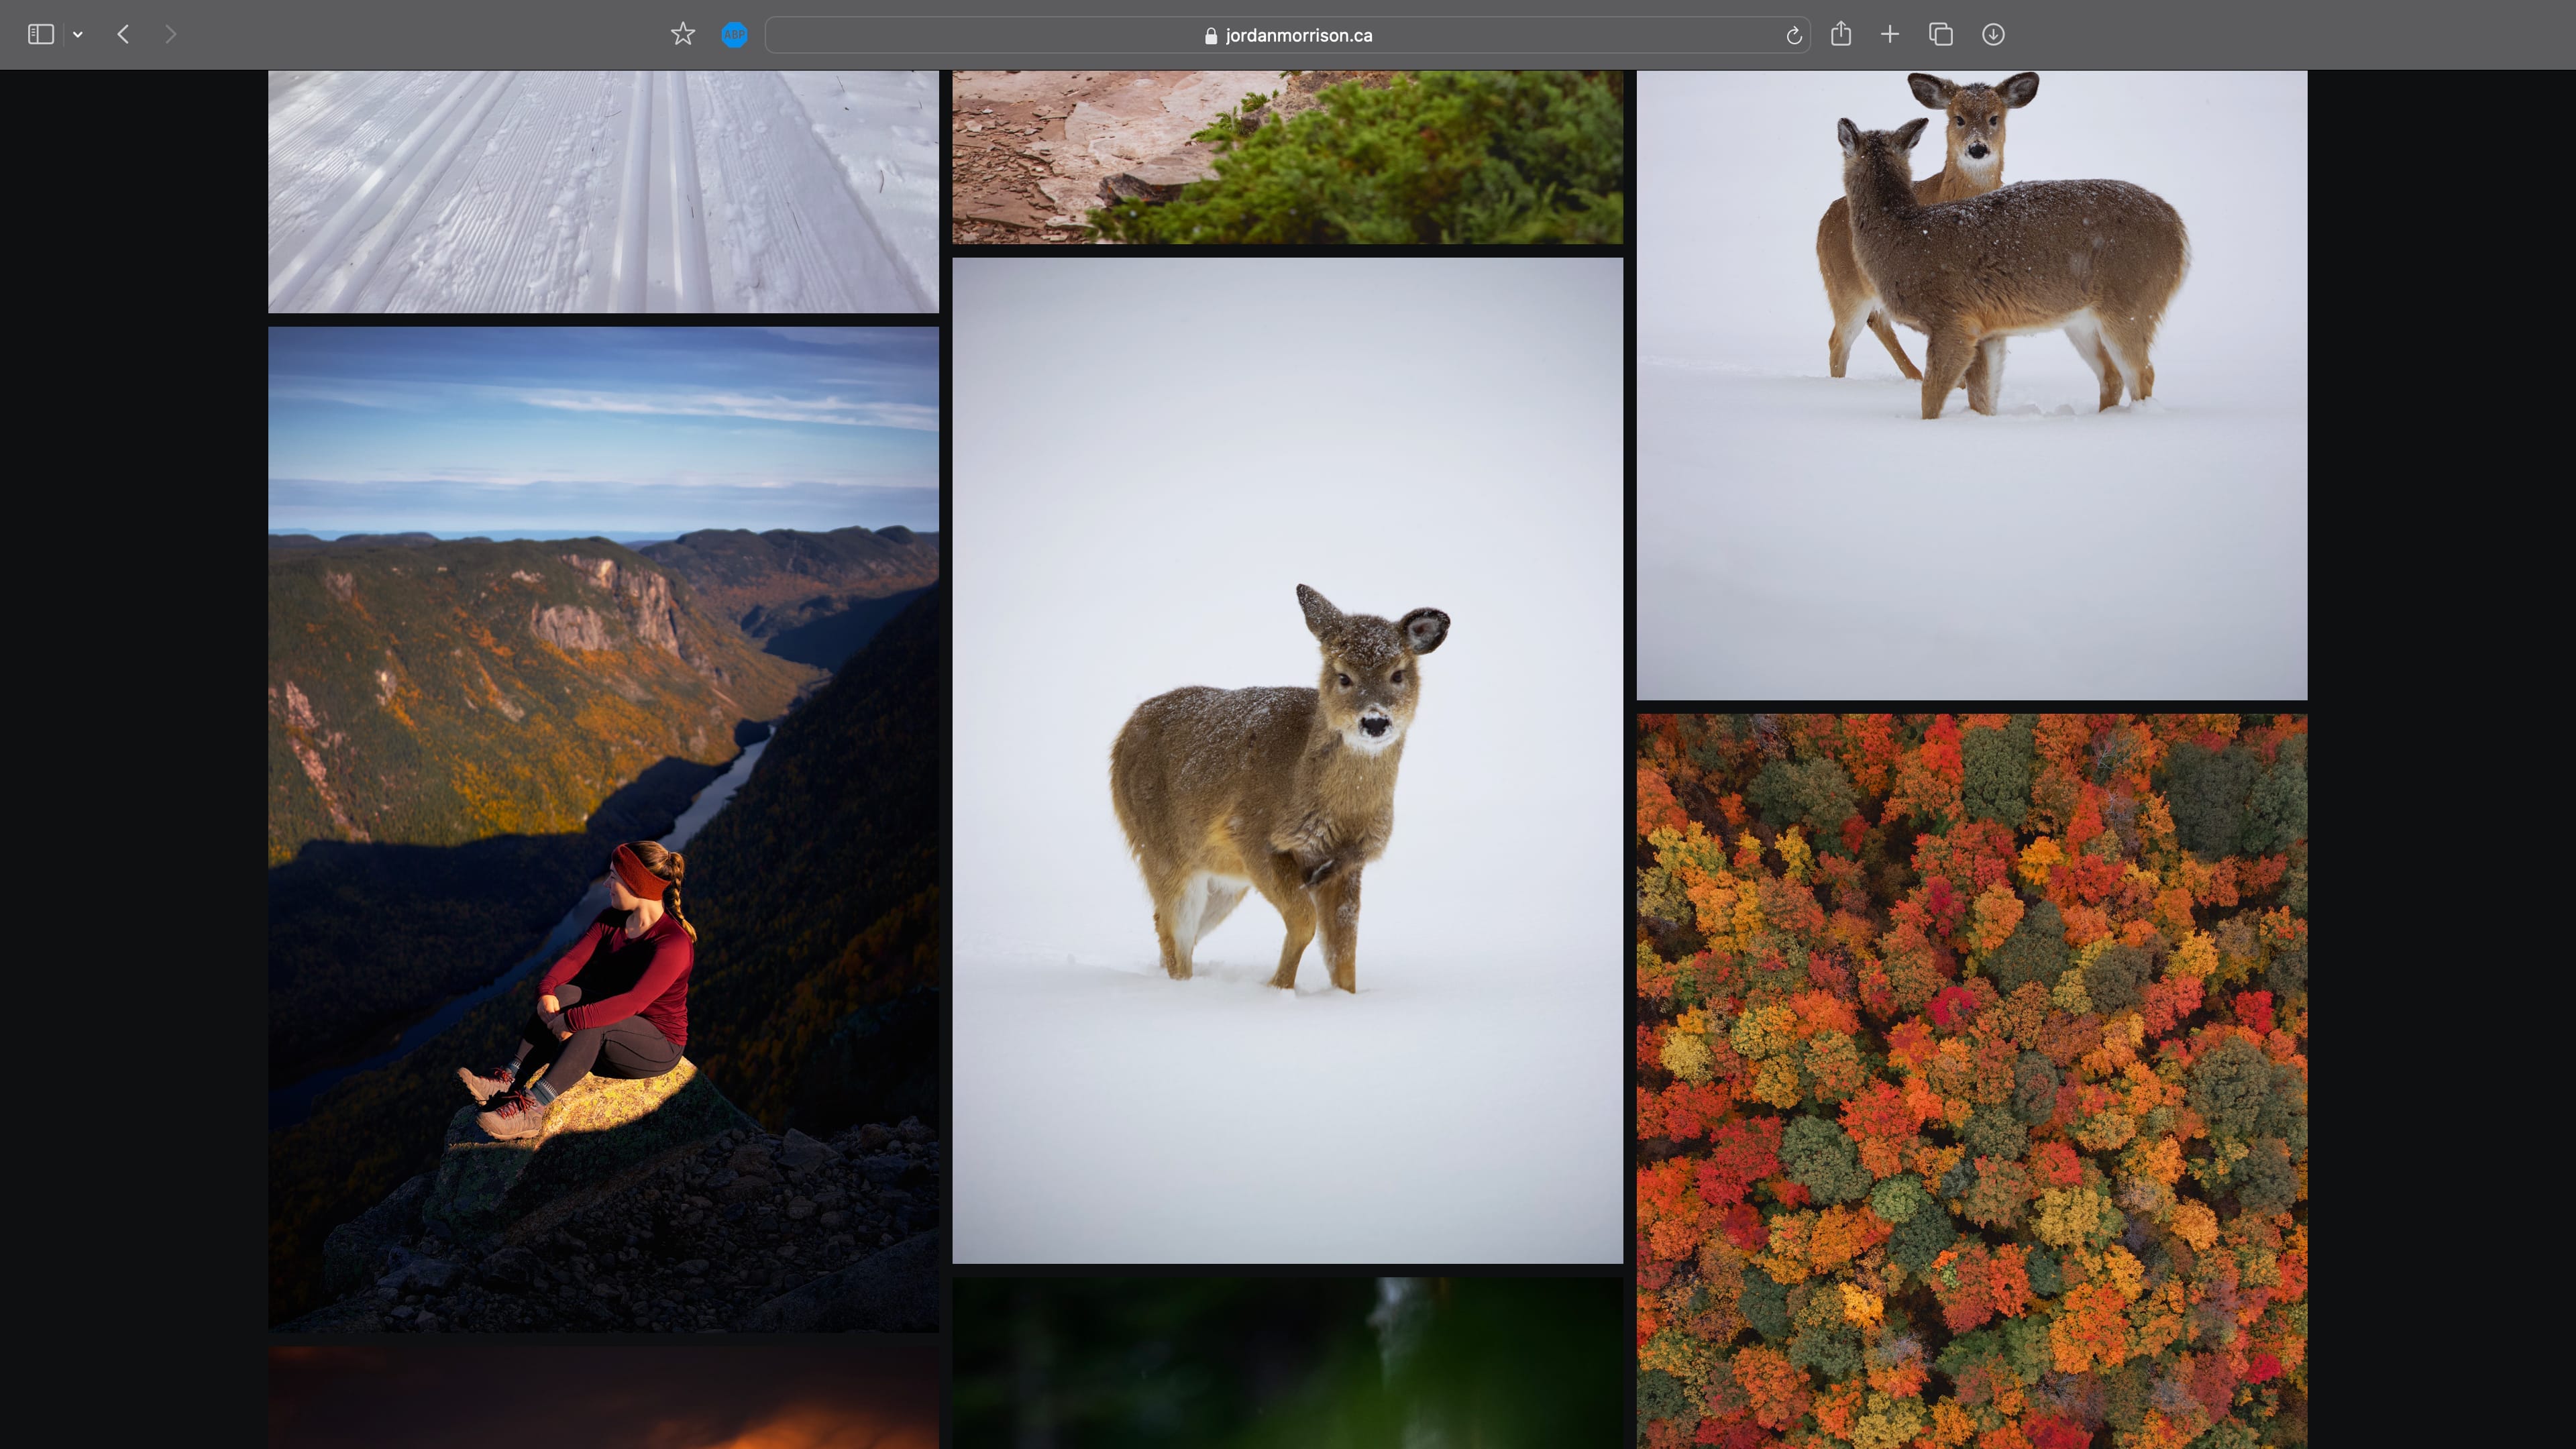
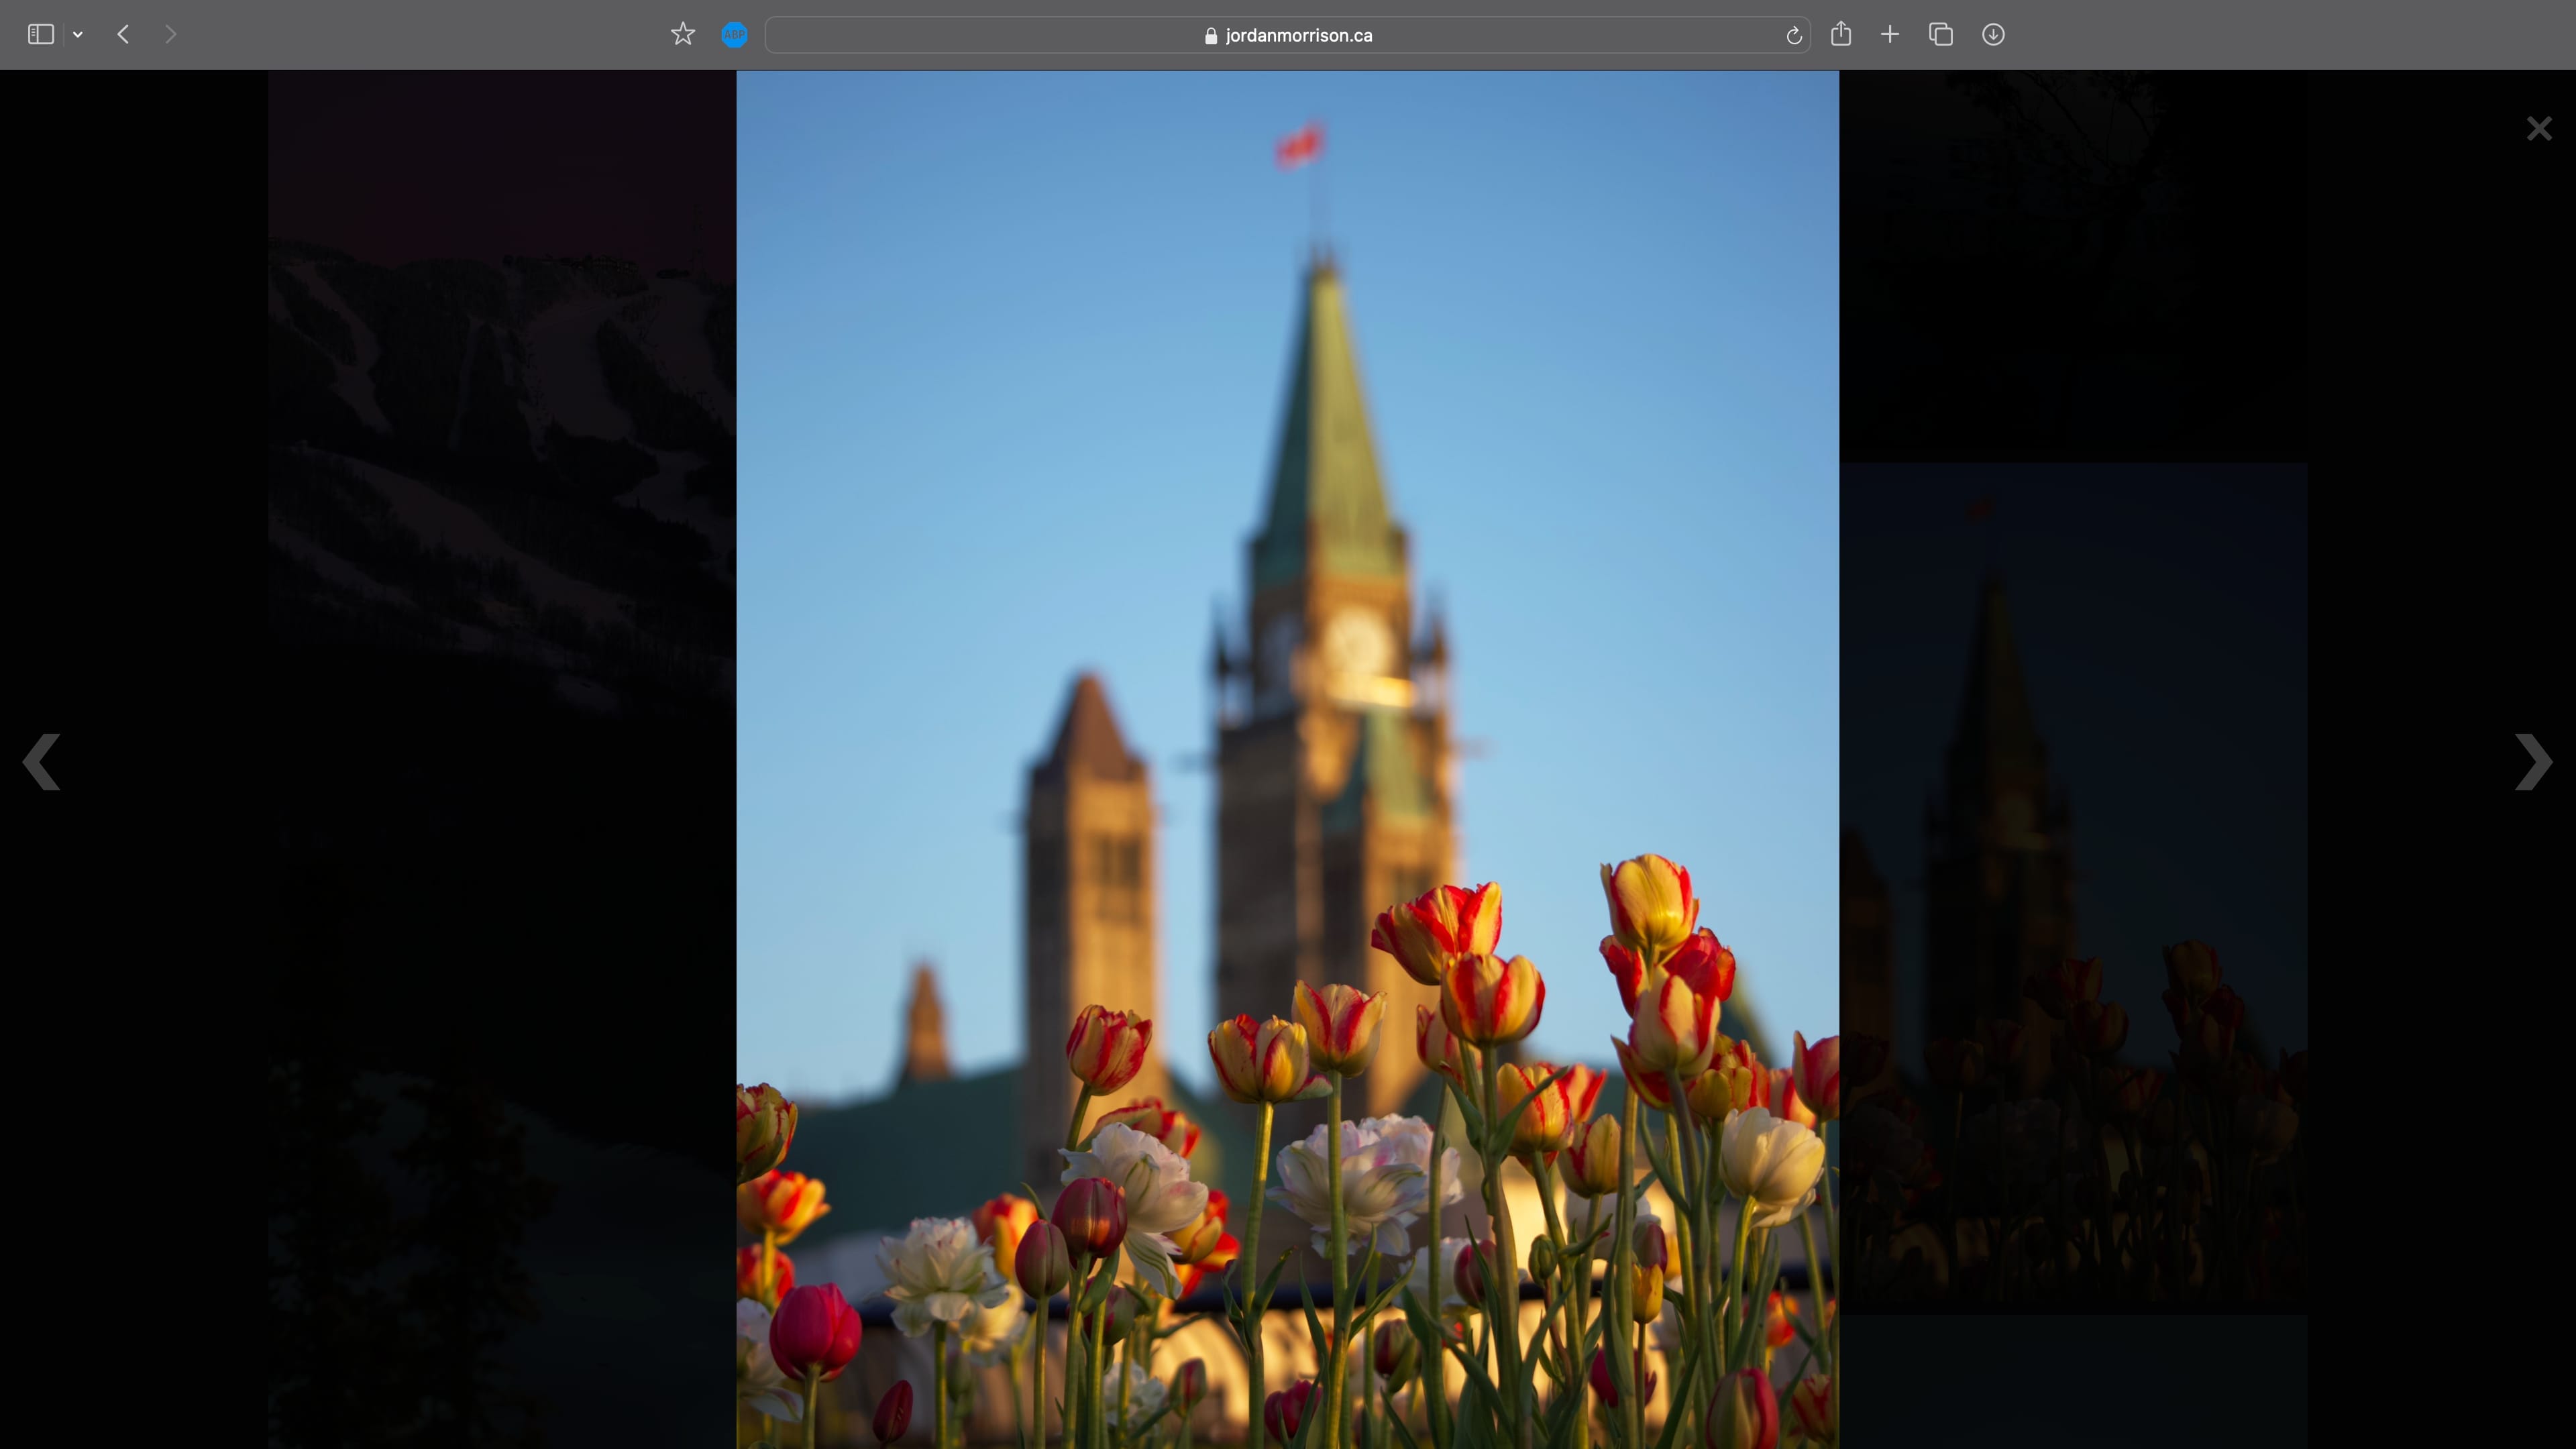
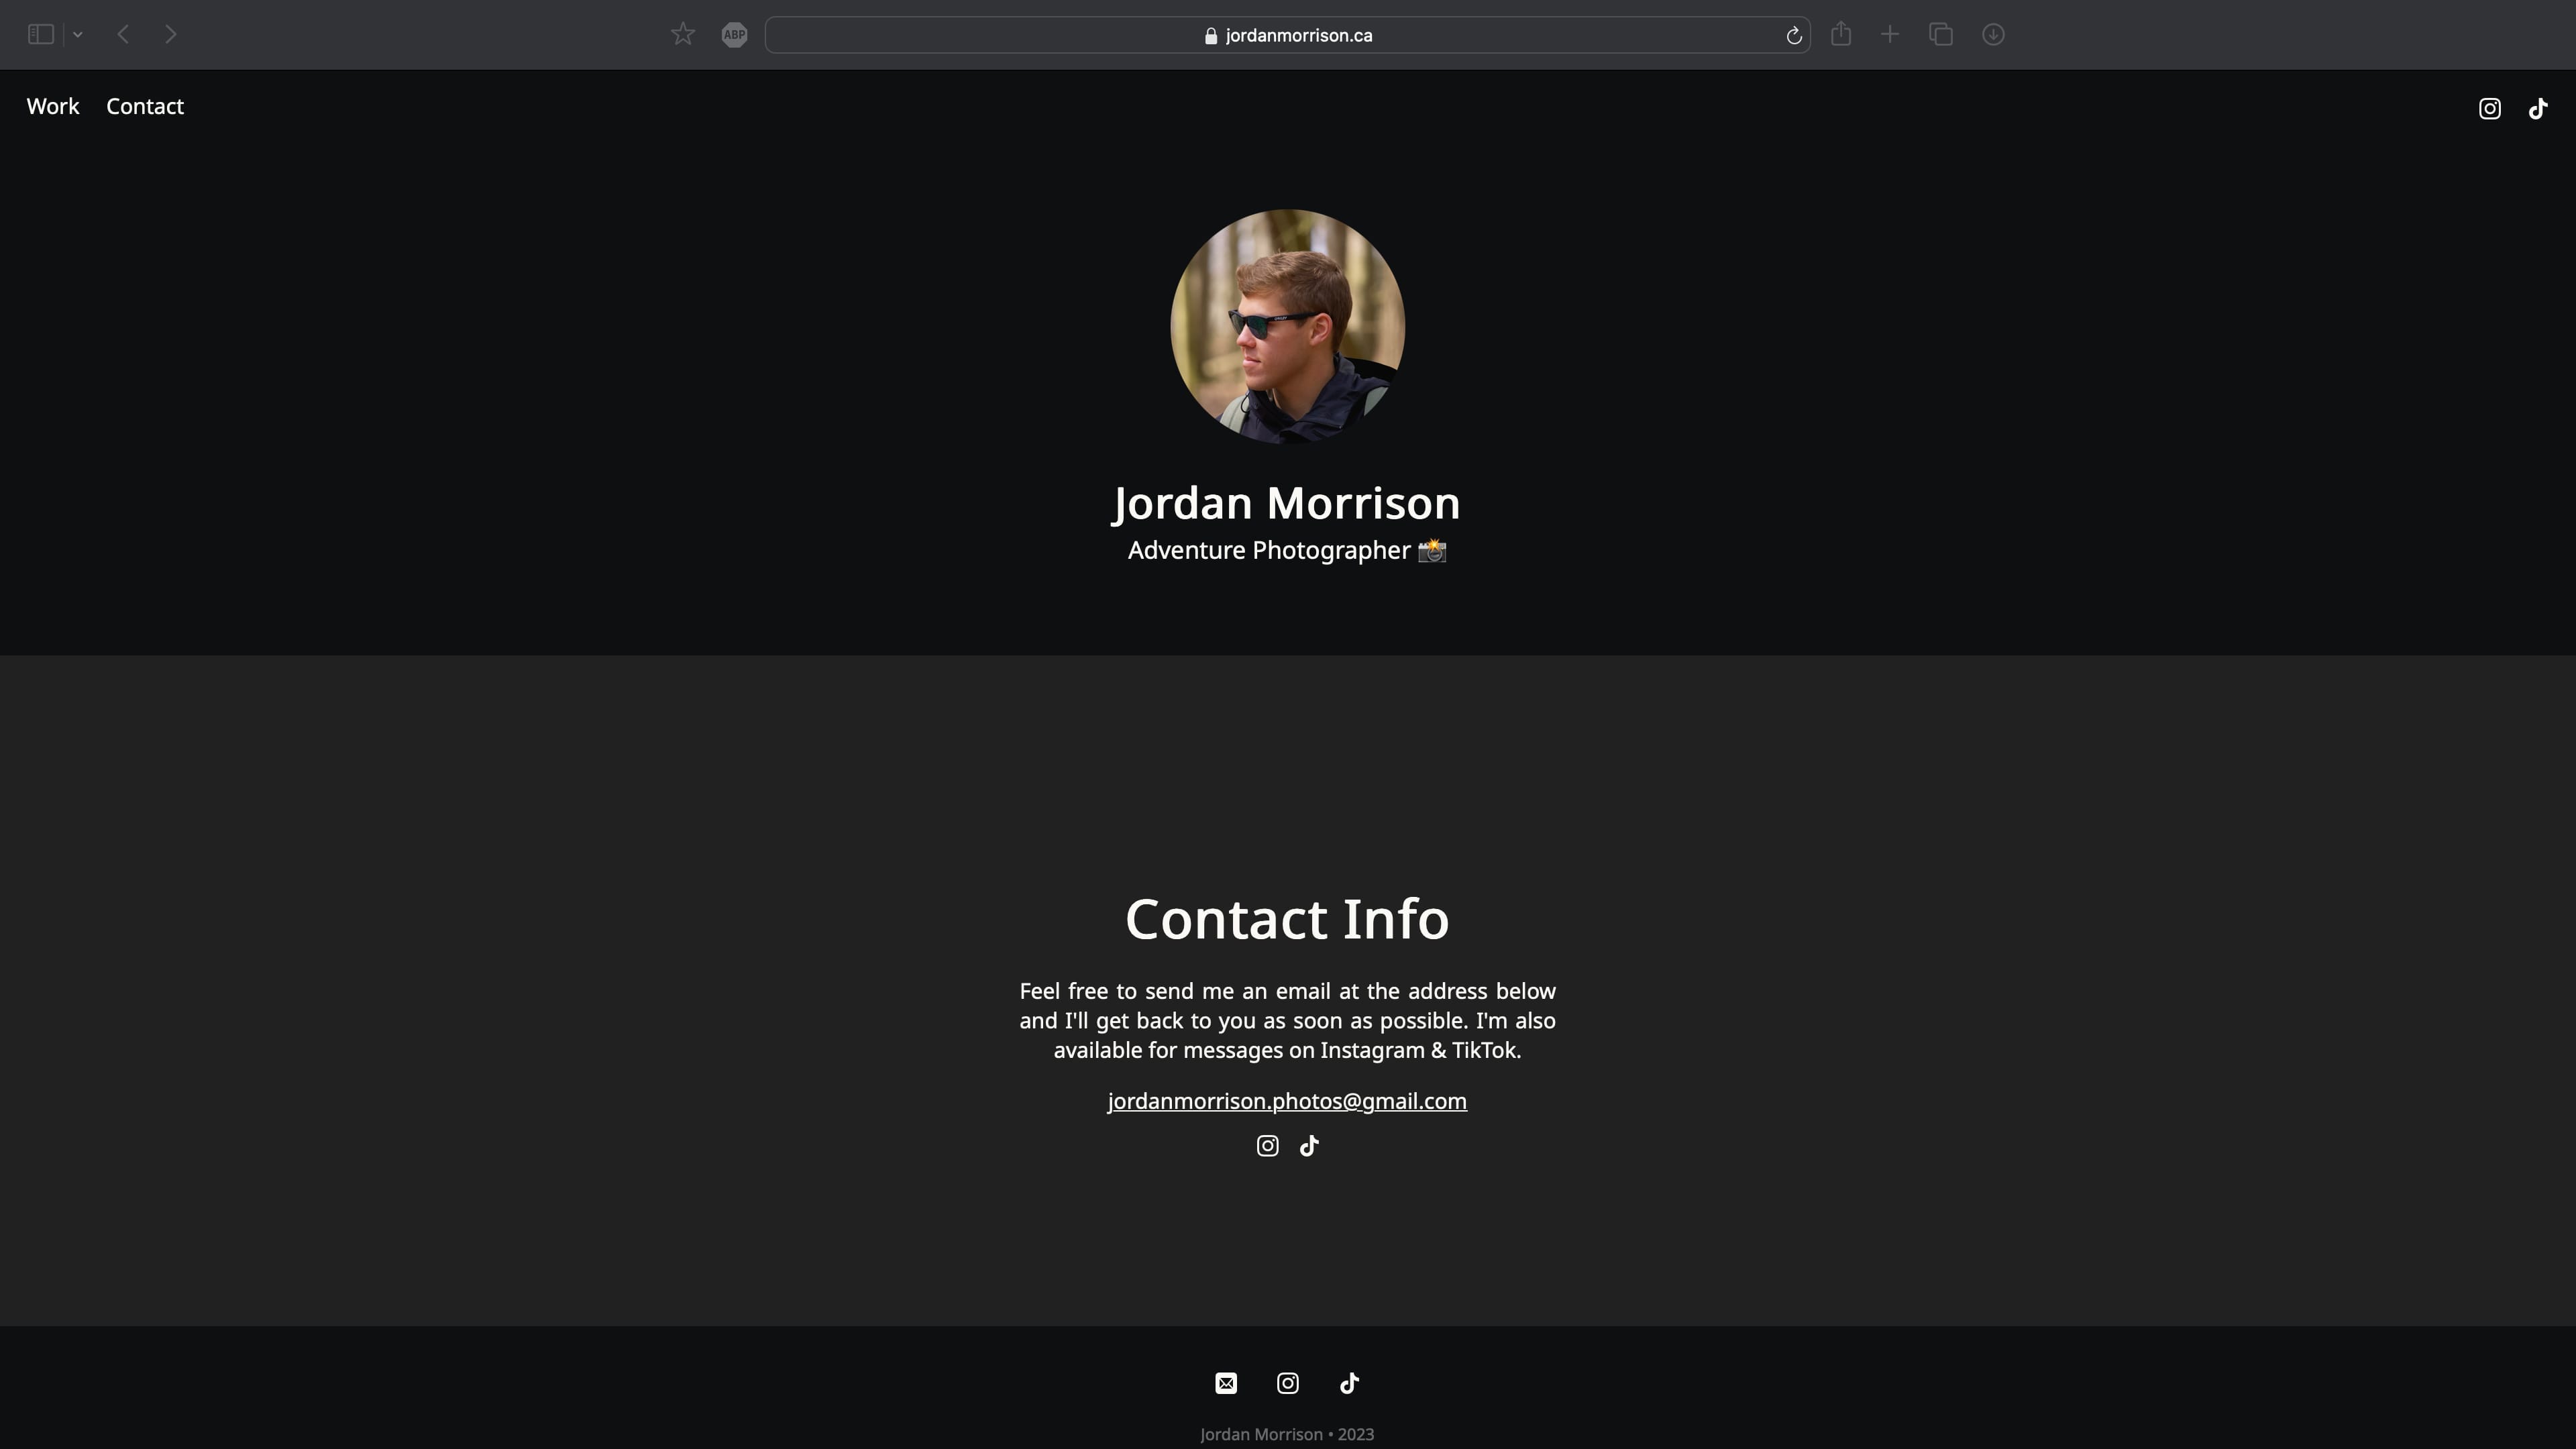
Built as my own portfolio, jordanmorrison.ca is a simple yet captivating website utilizing the latest web technologies. With millions of views on my social media it was important to create the site with lightweightness in mind as as the magnitude of visitors could quickly drive up hosting costs. With this, I'm proud to say I've done just that as the site remains online at near zero cost. Feature wise the site has a custom photo grid component, showcasing a selection of my photos along with a dynamic dark mode that automatically adjusts according to the user's browser and device settings. While simple, this site helps to create an immersive and visually stunning experience for visitors to explore my photographic work all while staying lightweight to keep costs down.
- Next.js
- React
- JavaScript
- HTML
- CSS
 Pixelmator Pro
- Adobe Photoshop
CHA Data Map
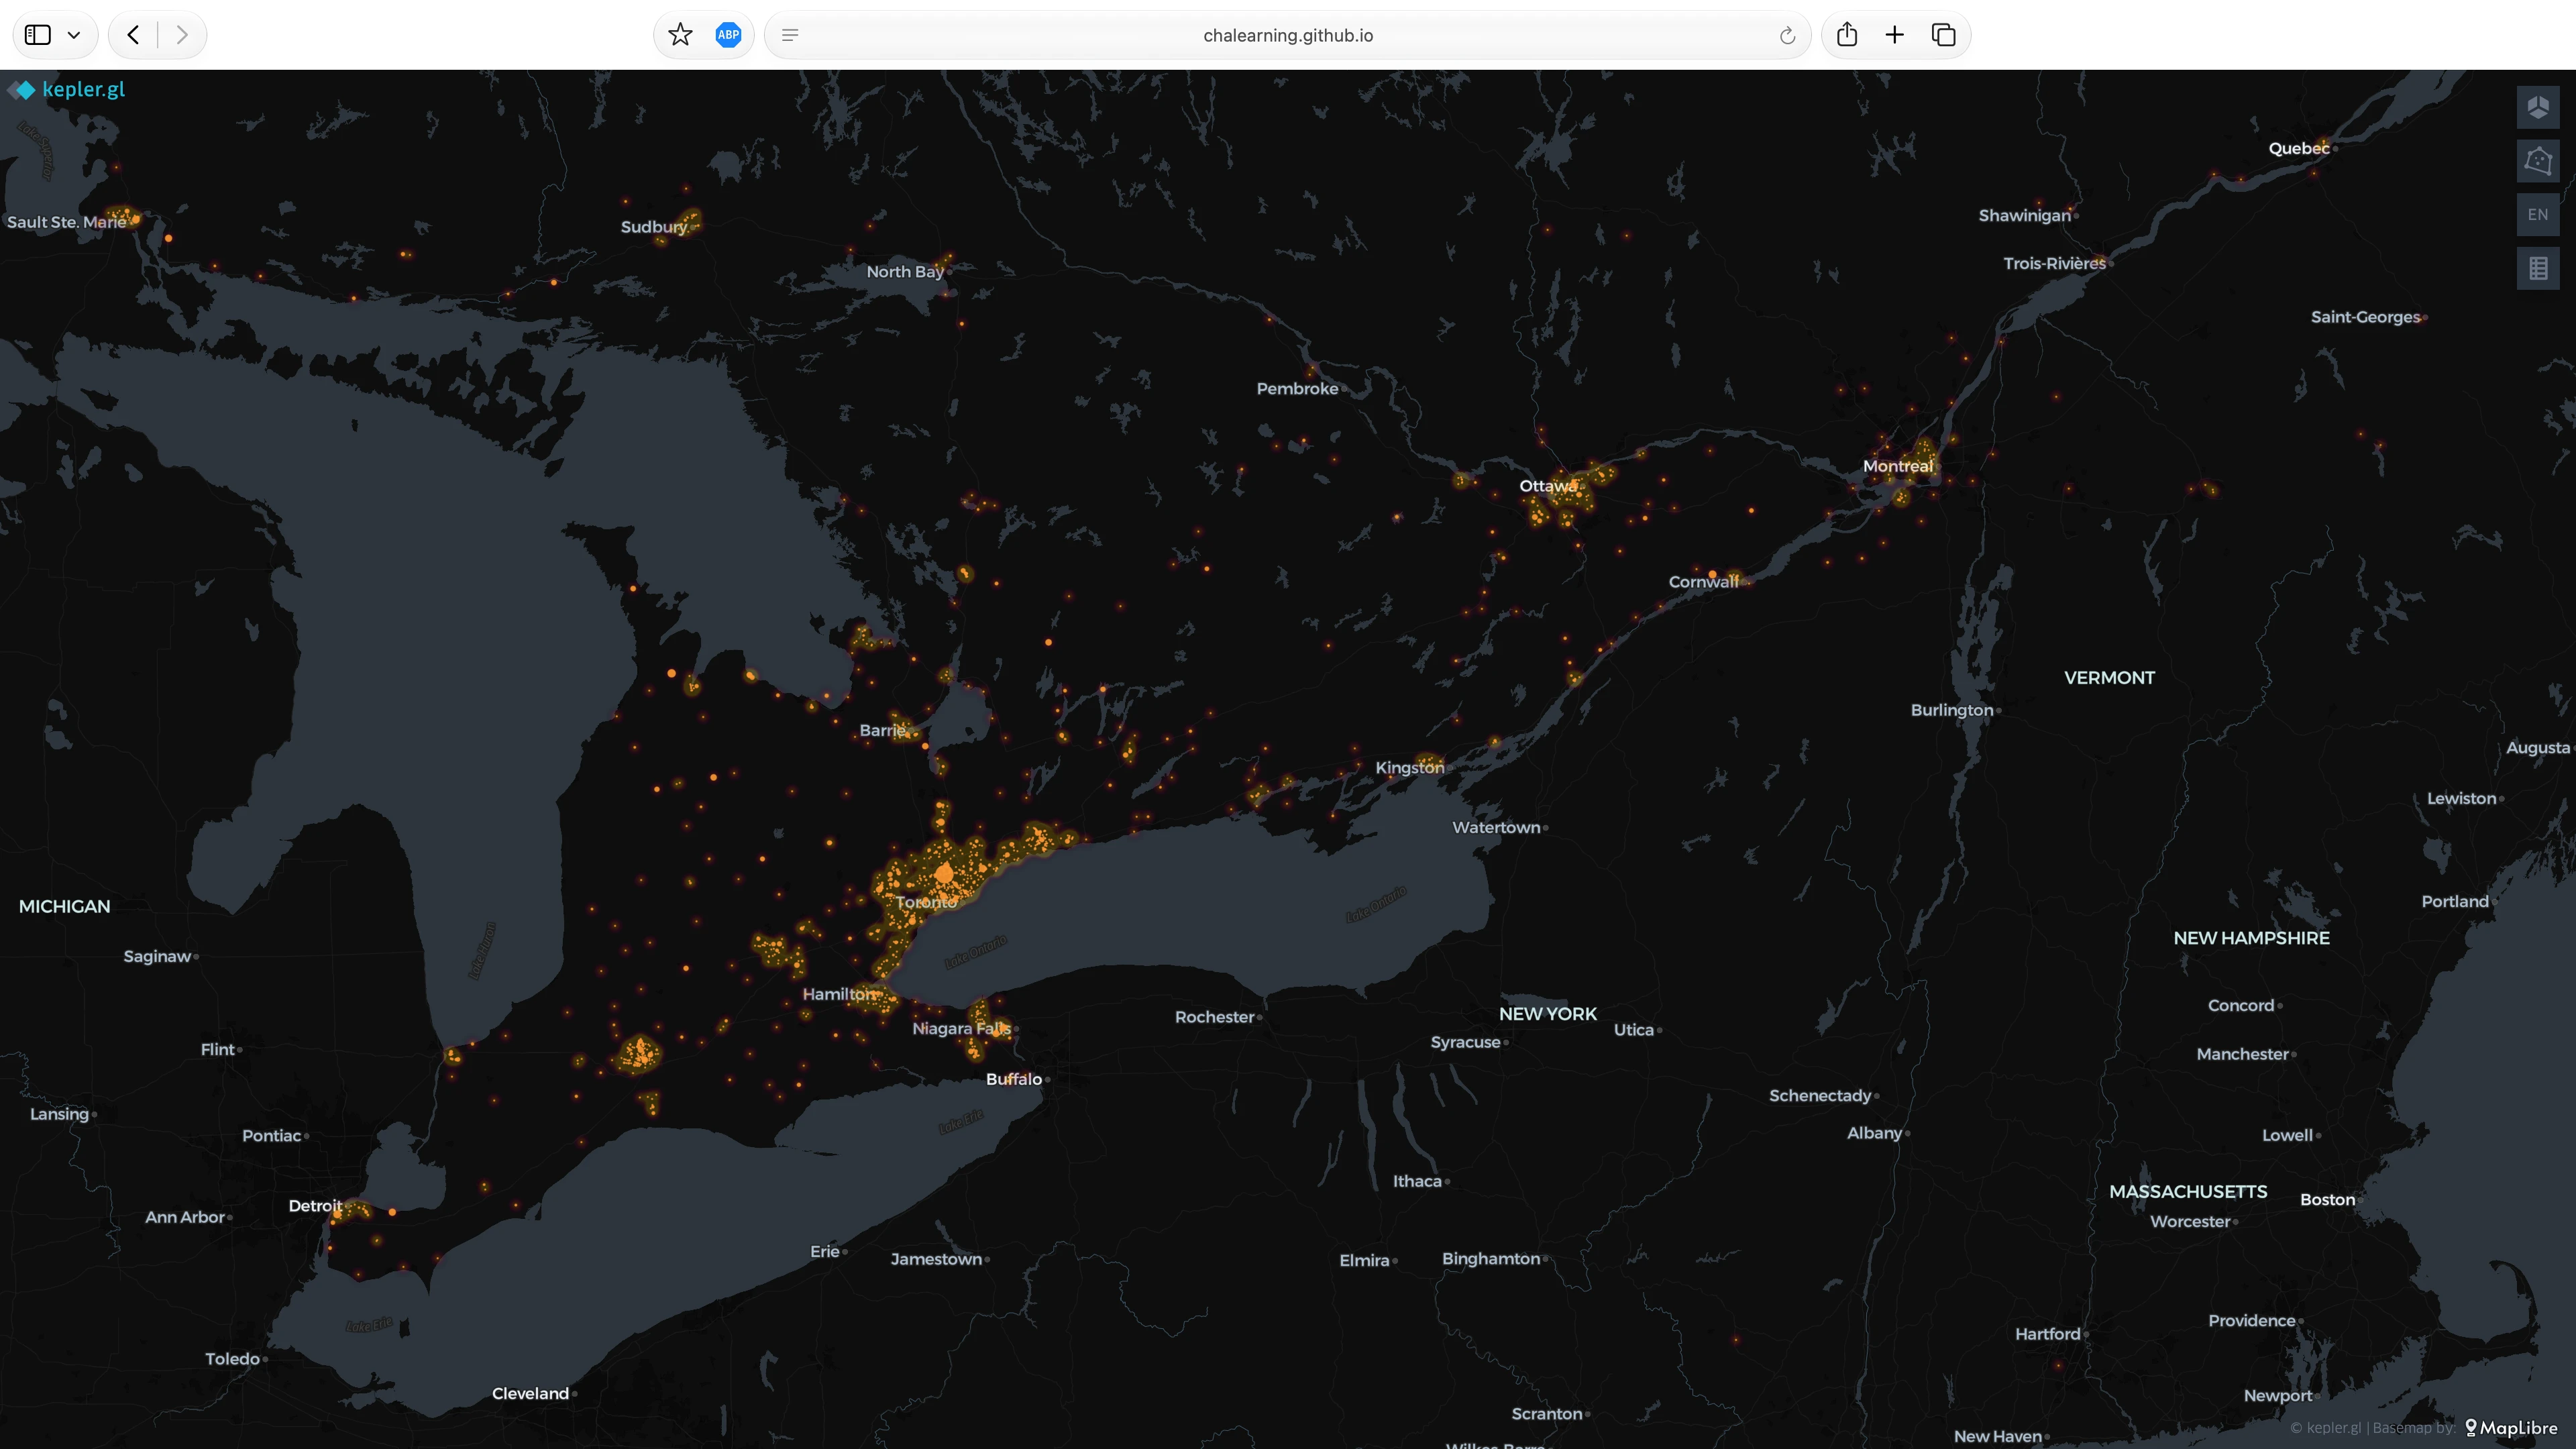
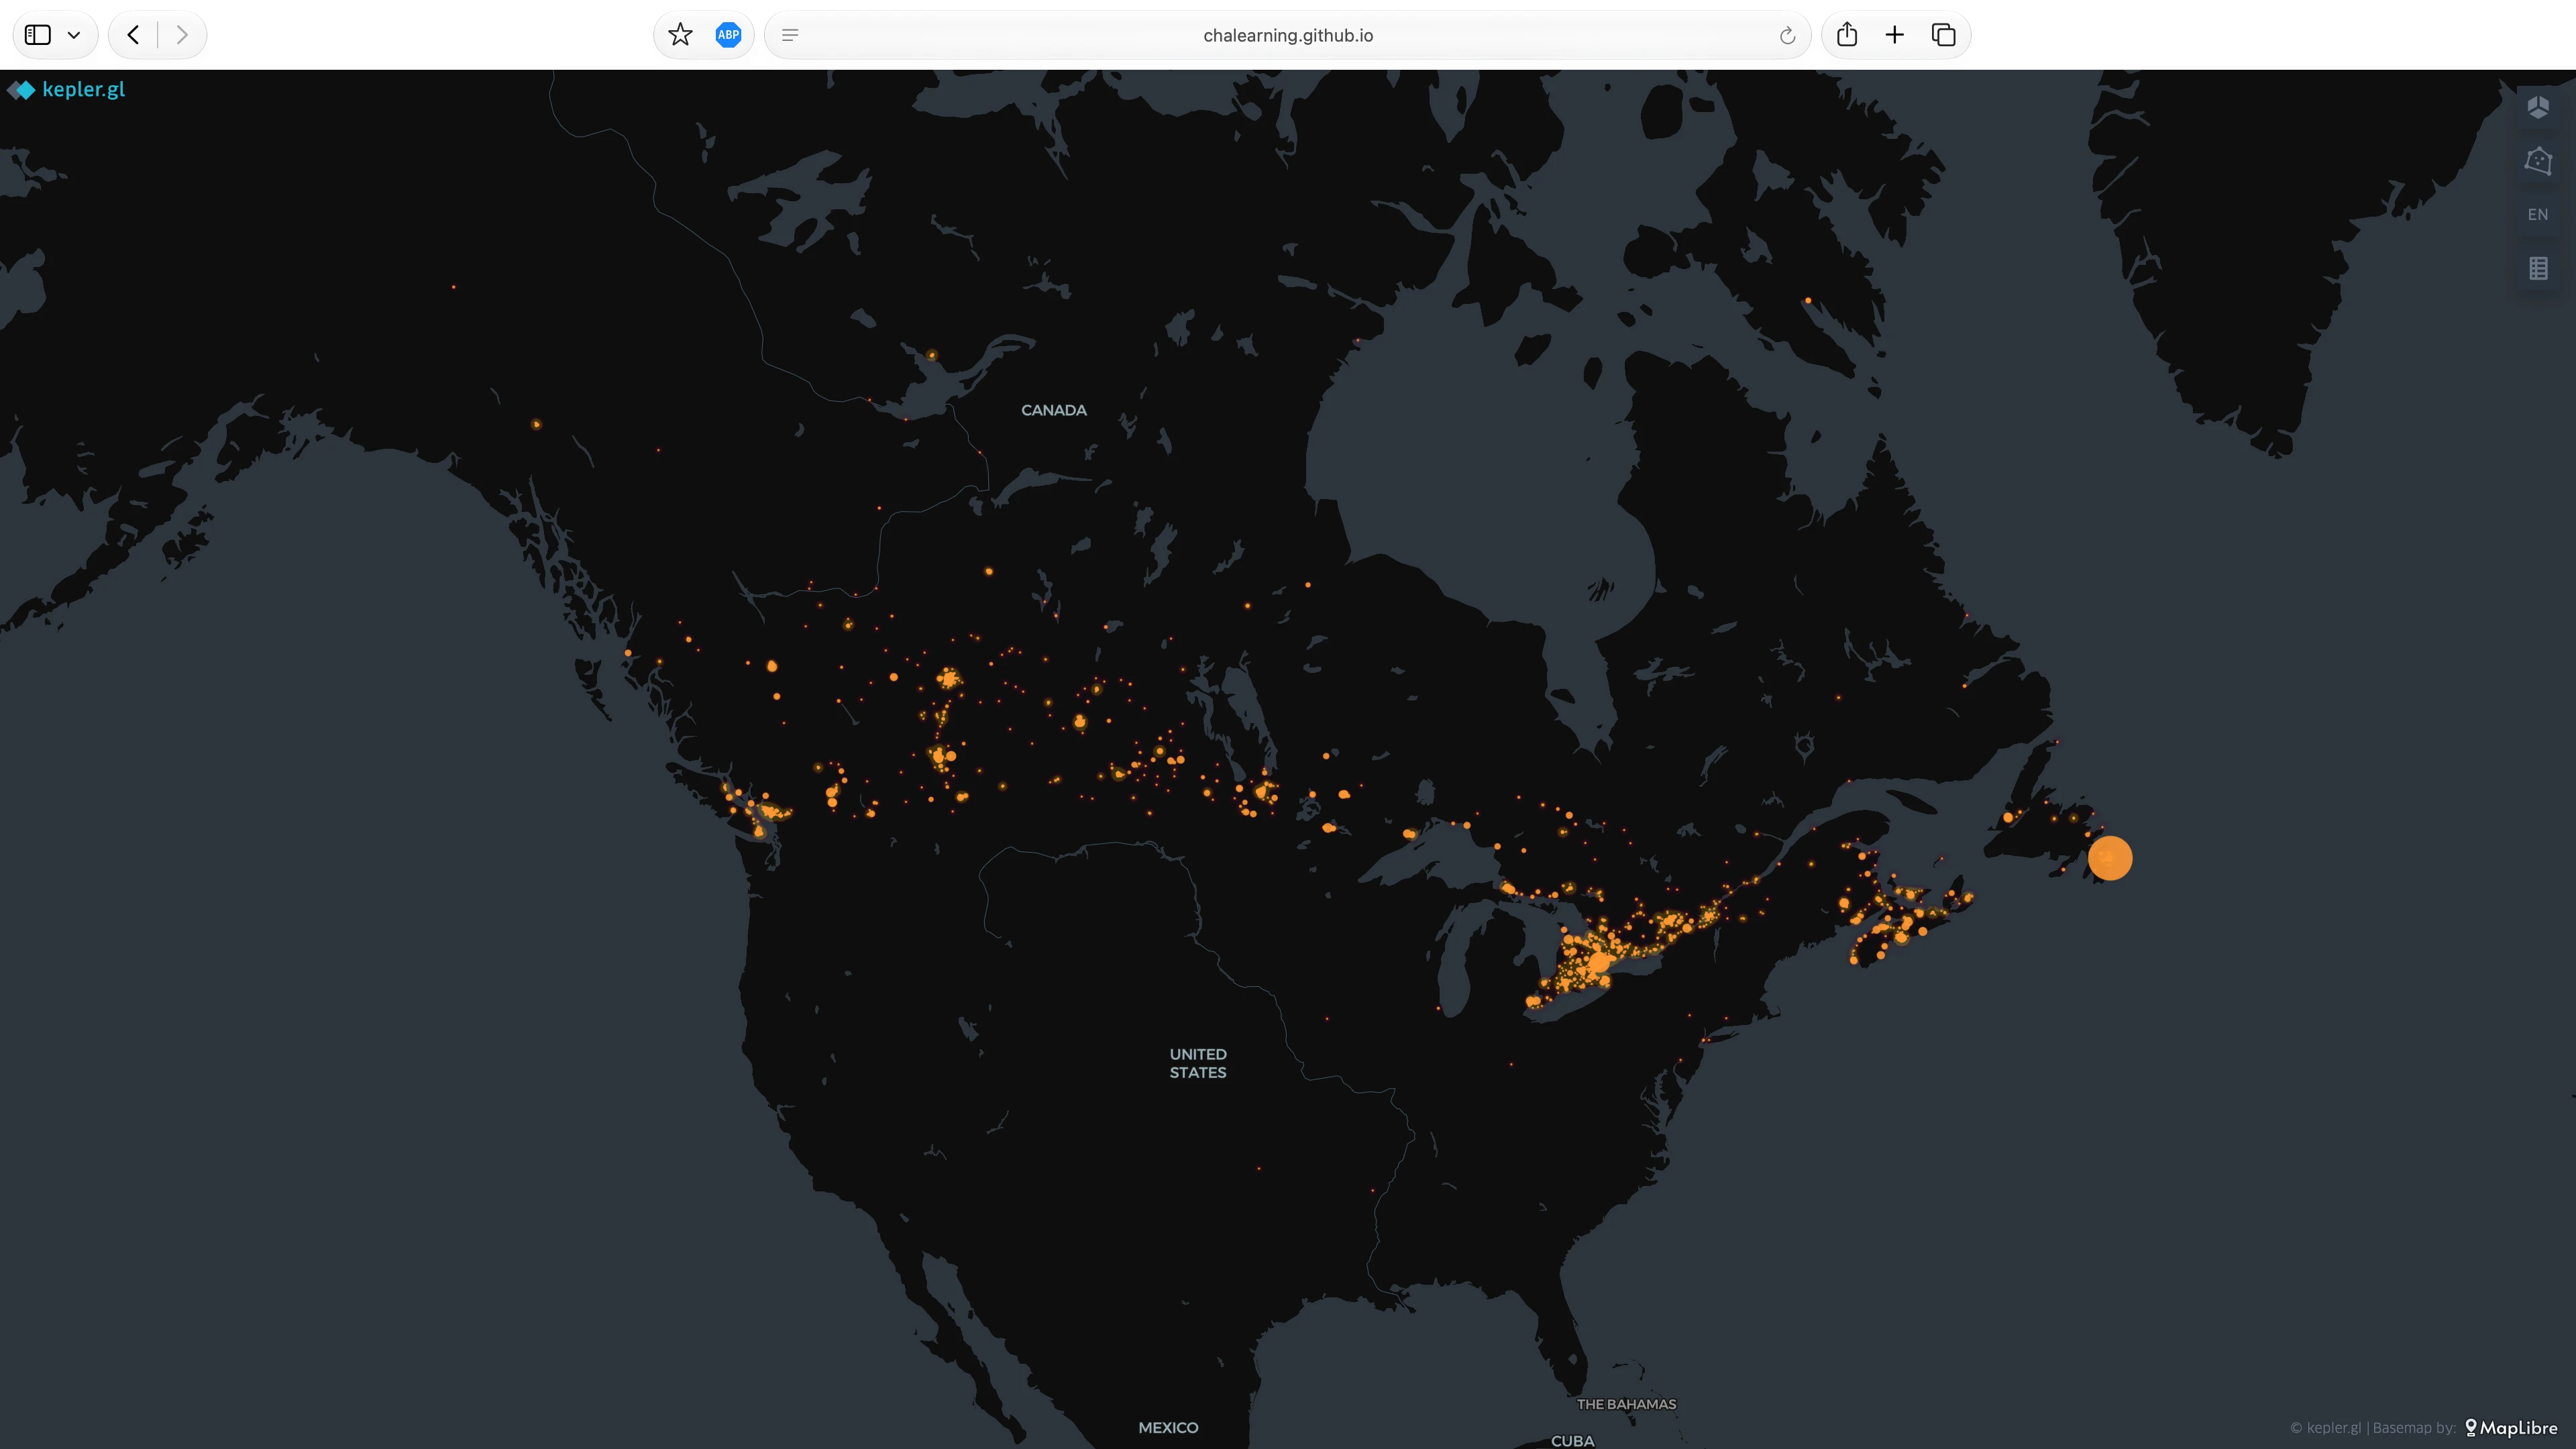
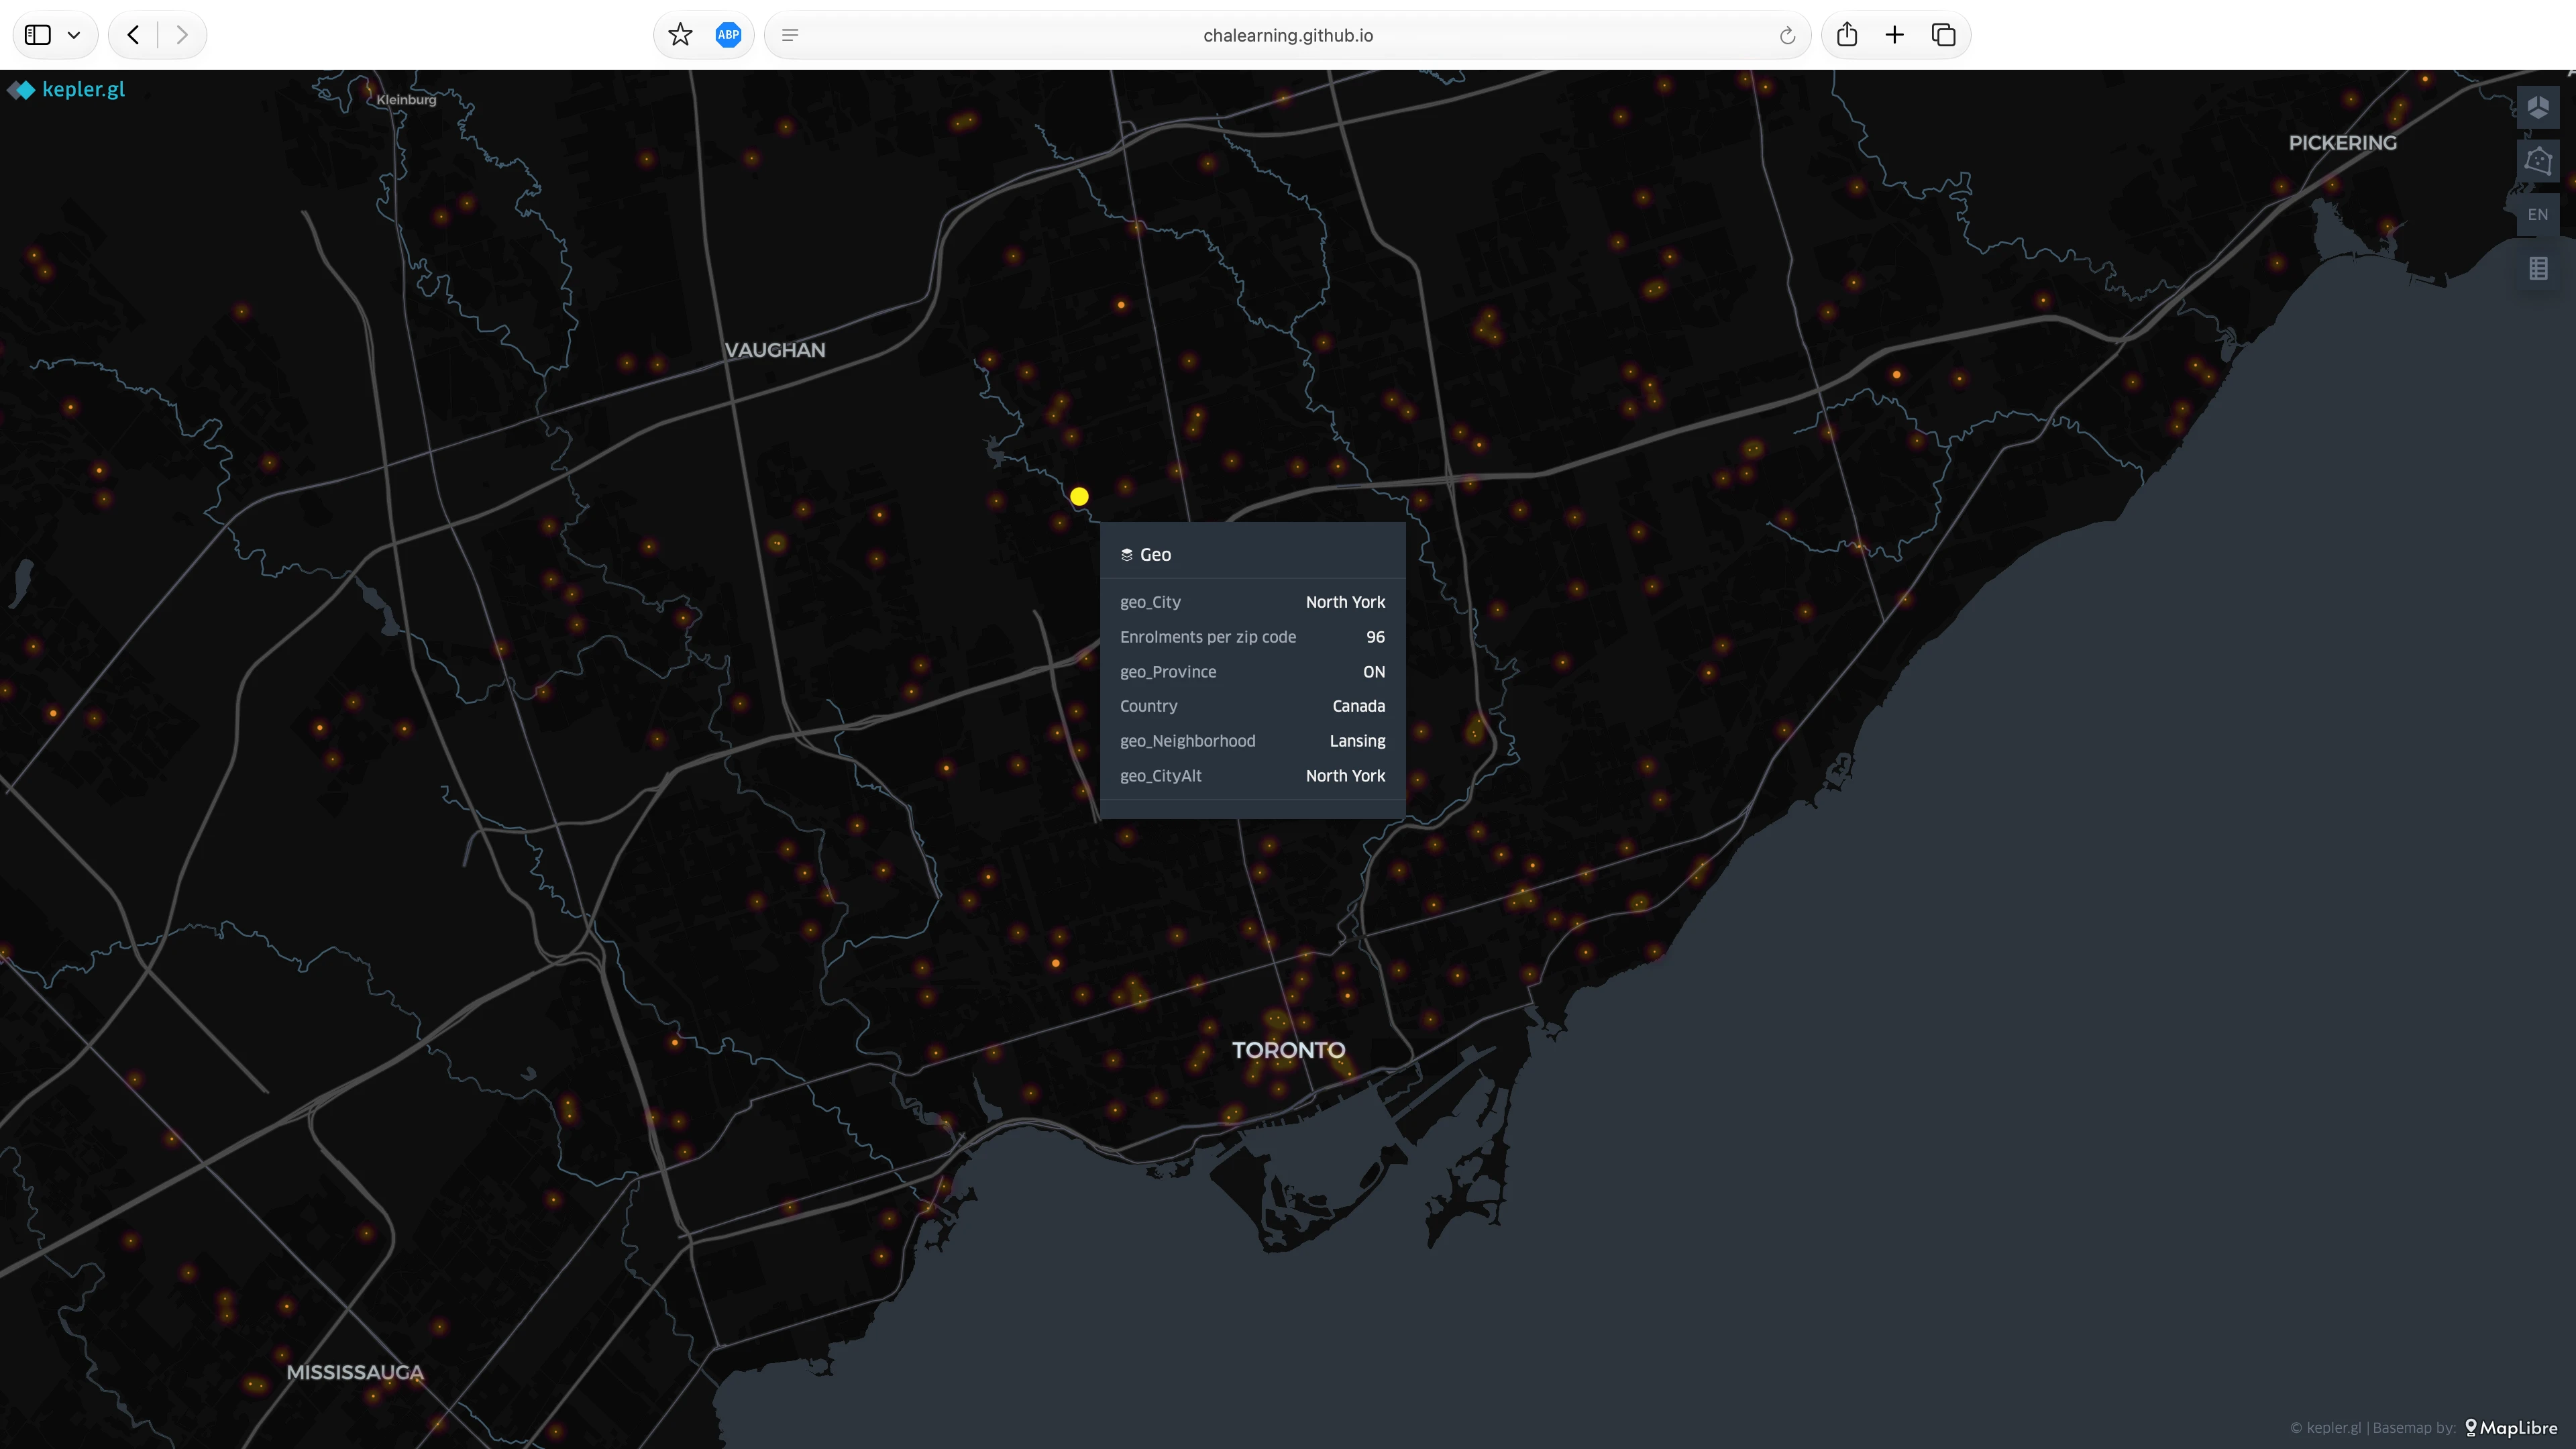
The CHA Data Map is an interactive geospatial visualization I developed for HealthCareCAN’s CHA Learning division to explore the geographic distribution of our learner registrations across Canada. Our registration data contained only postal codes, so I sourced a 73 MB Canadian postal code dataset containing geographic coordinates to make mapping possible. A custom Node.js script processed the large CSV files, matched learner registrations to their coordinates and transformed the results into usable JSON. The resulting data was imported into Kepler.gl to create the interactive visualization, then exported for the web and deployed through GitHub Pages.
- Node.js
- JavaScript
- React
- HTML
- CSS
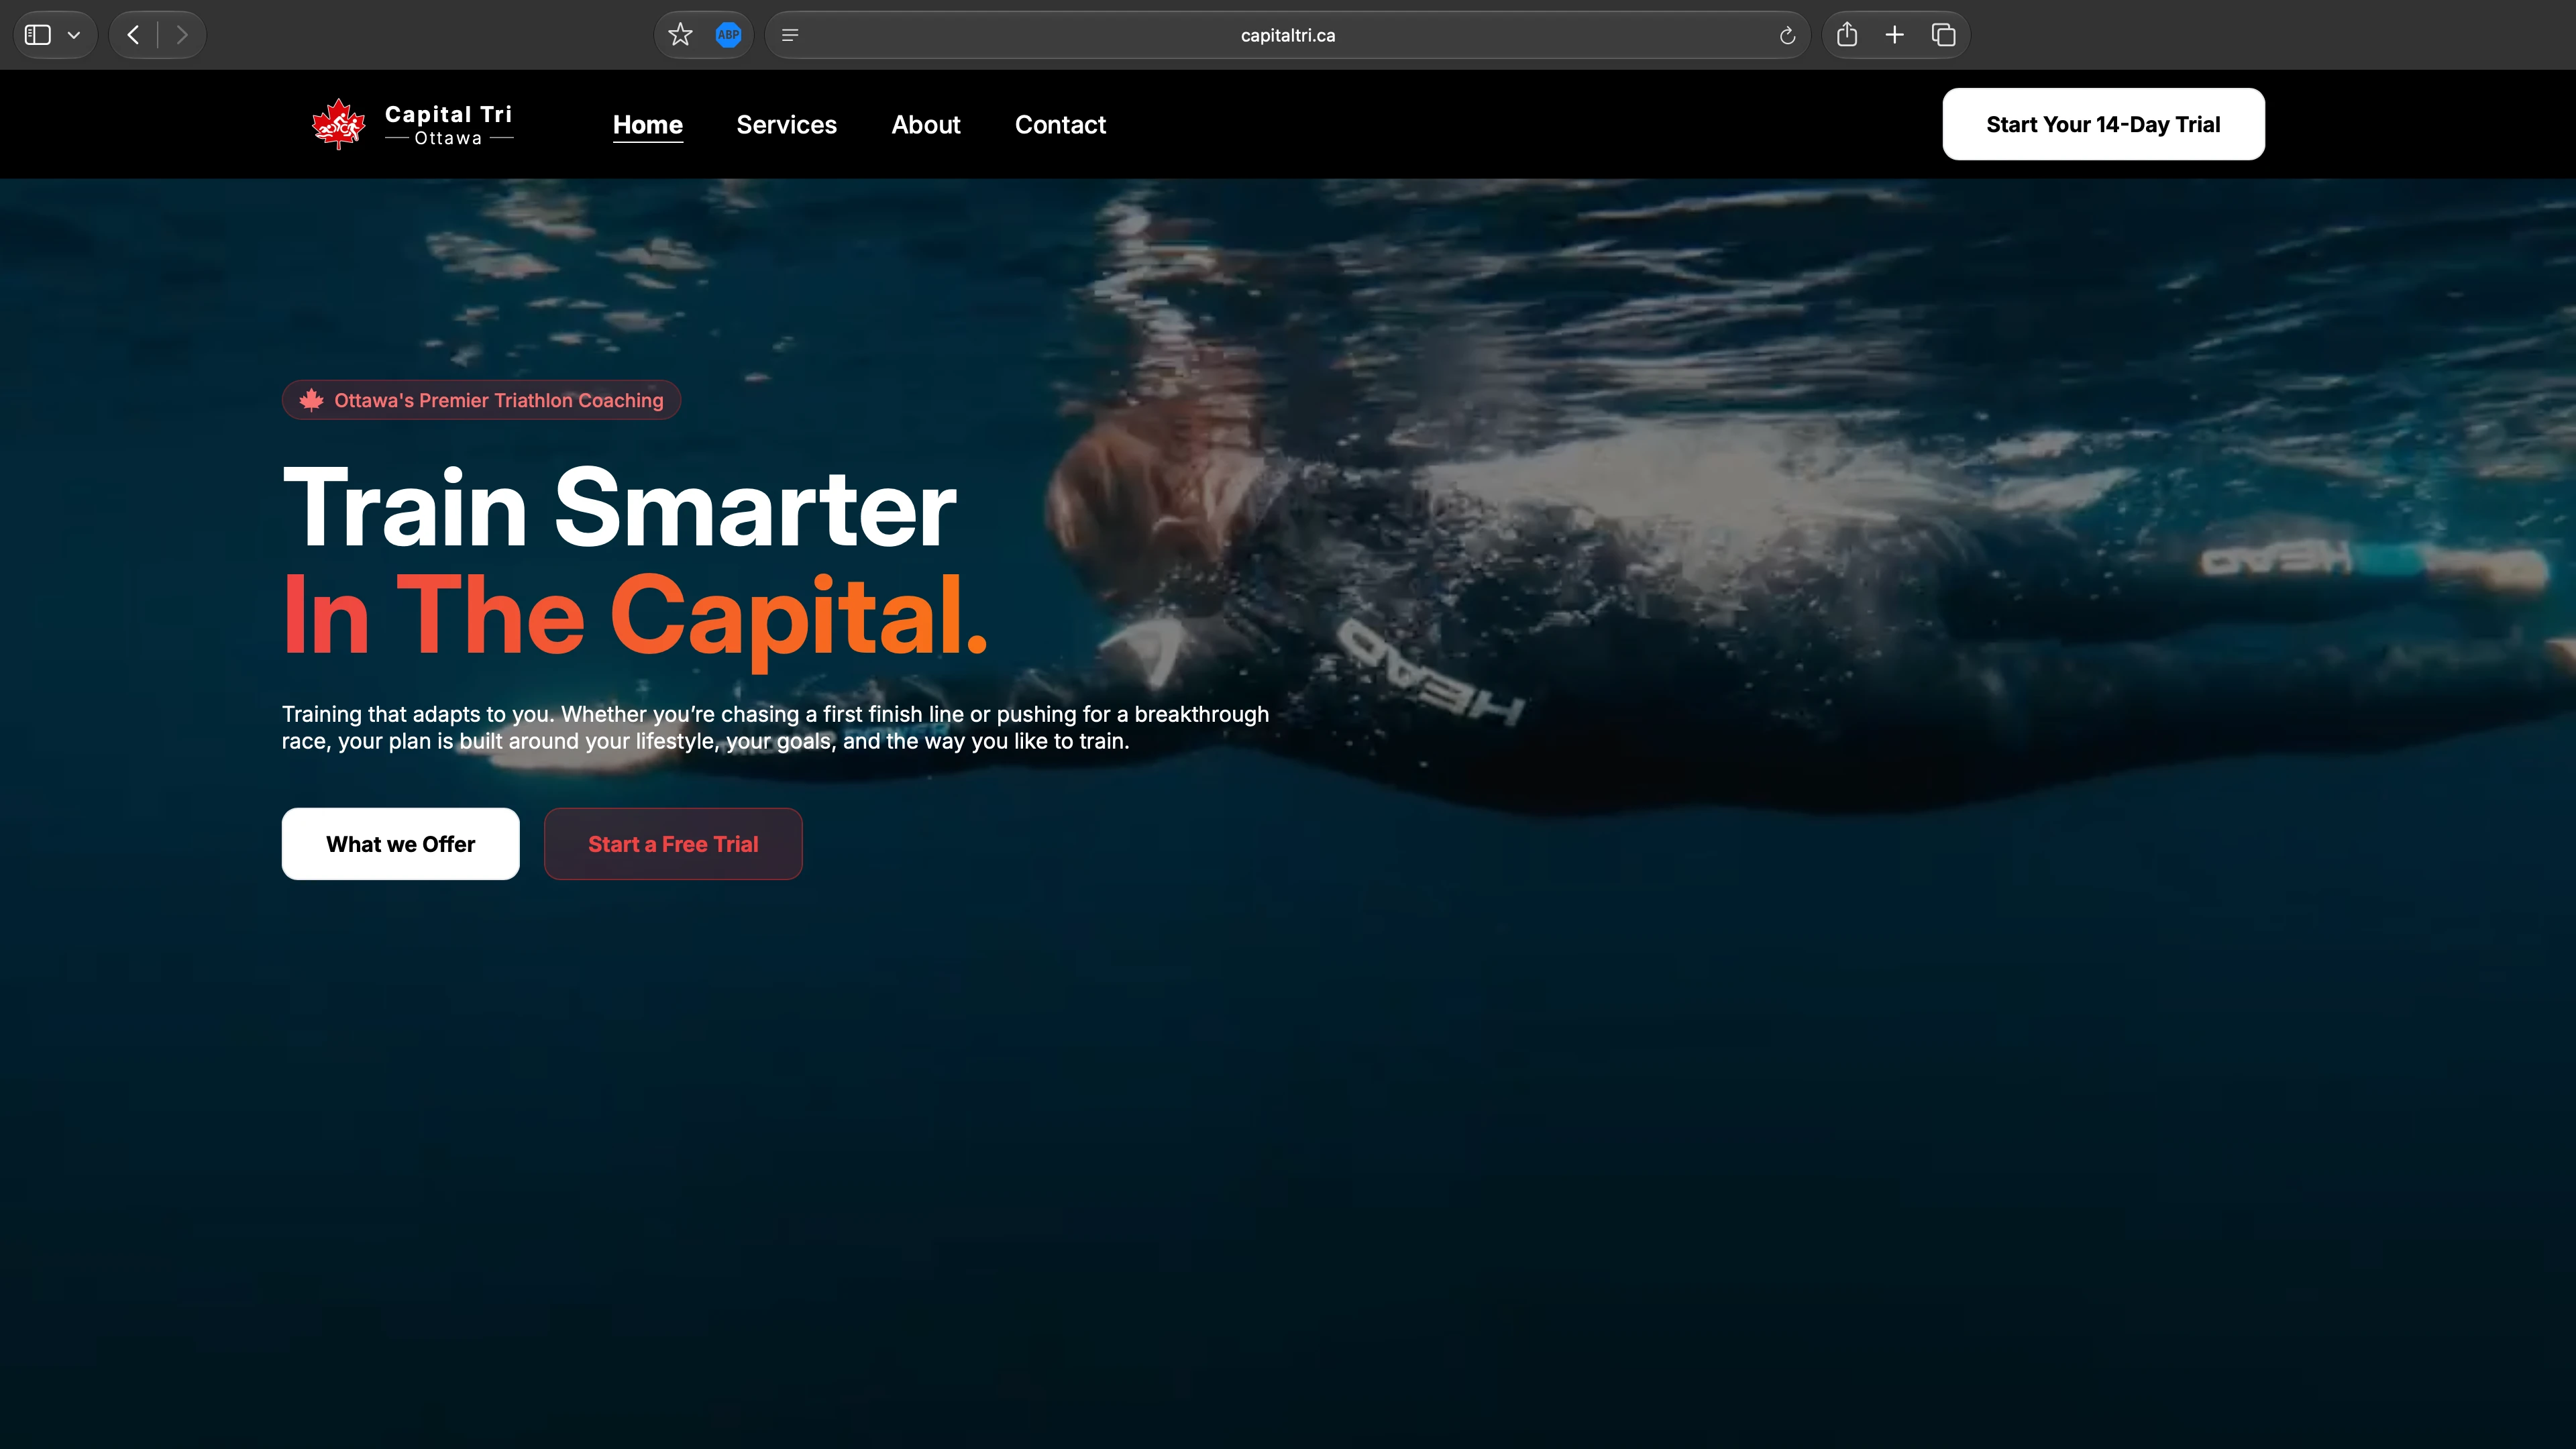
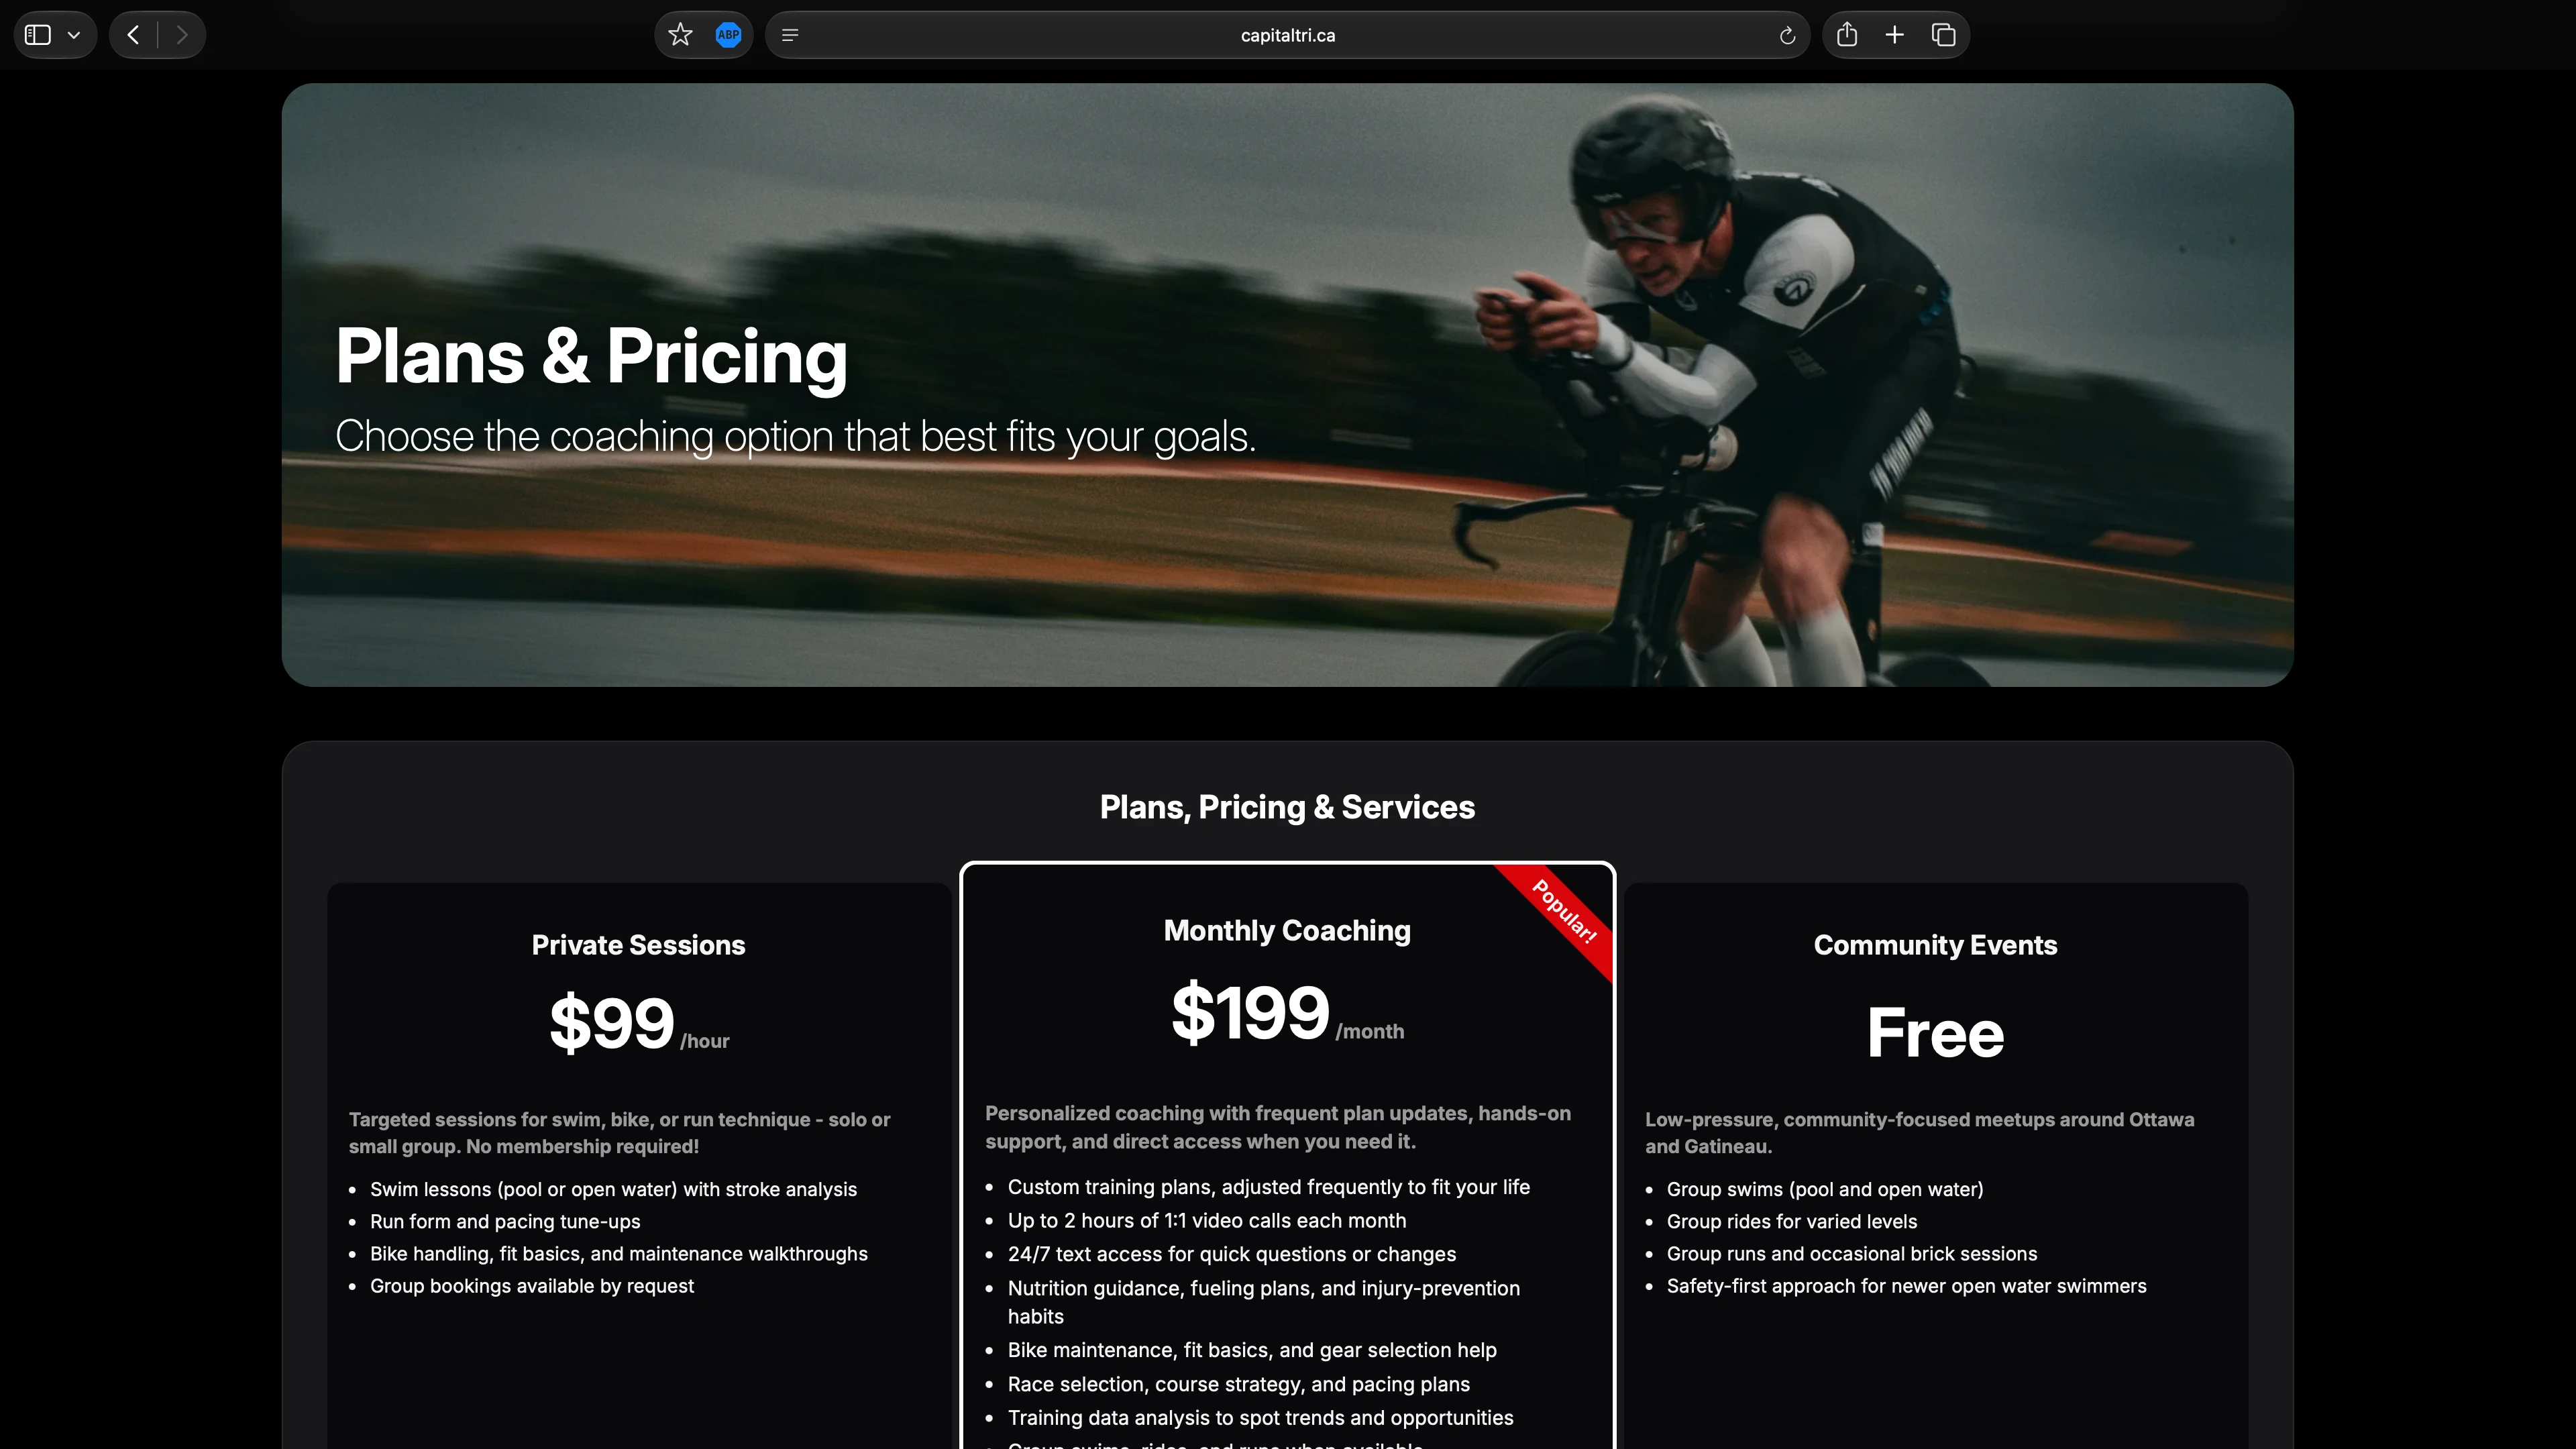
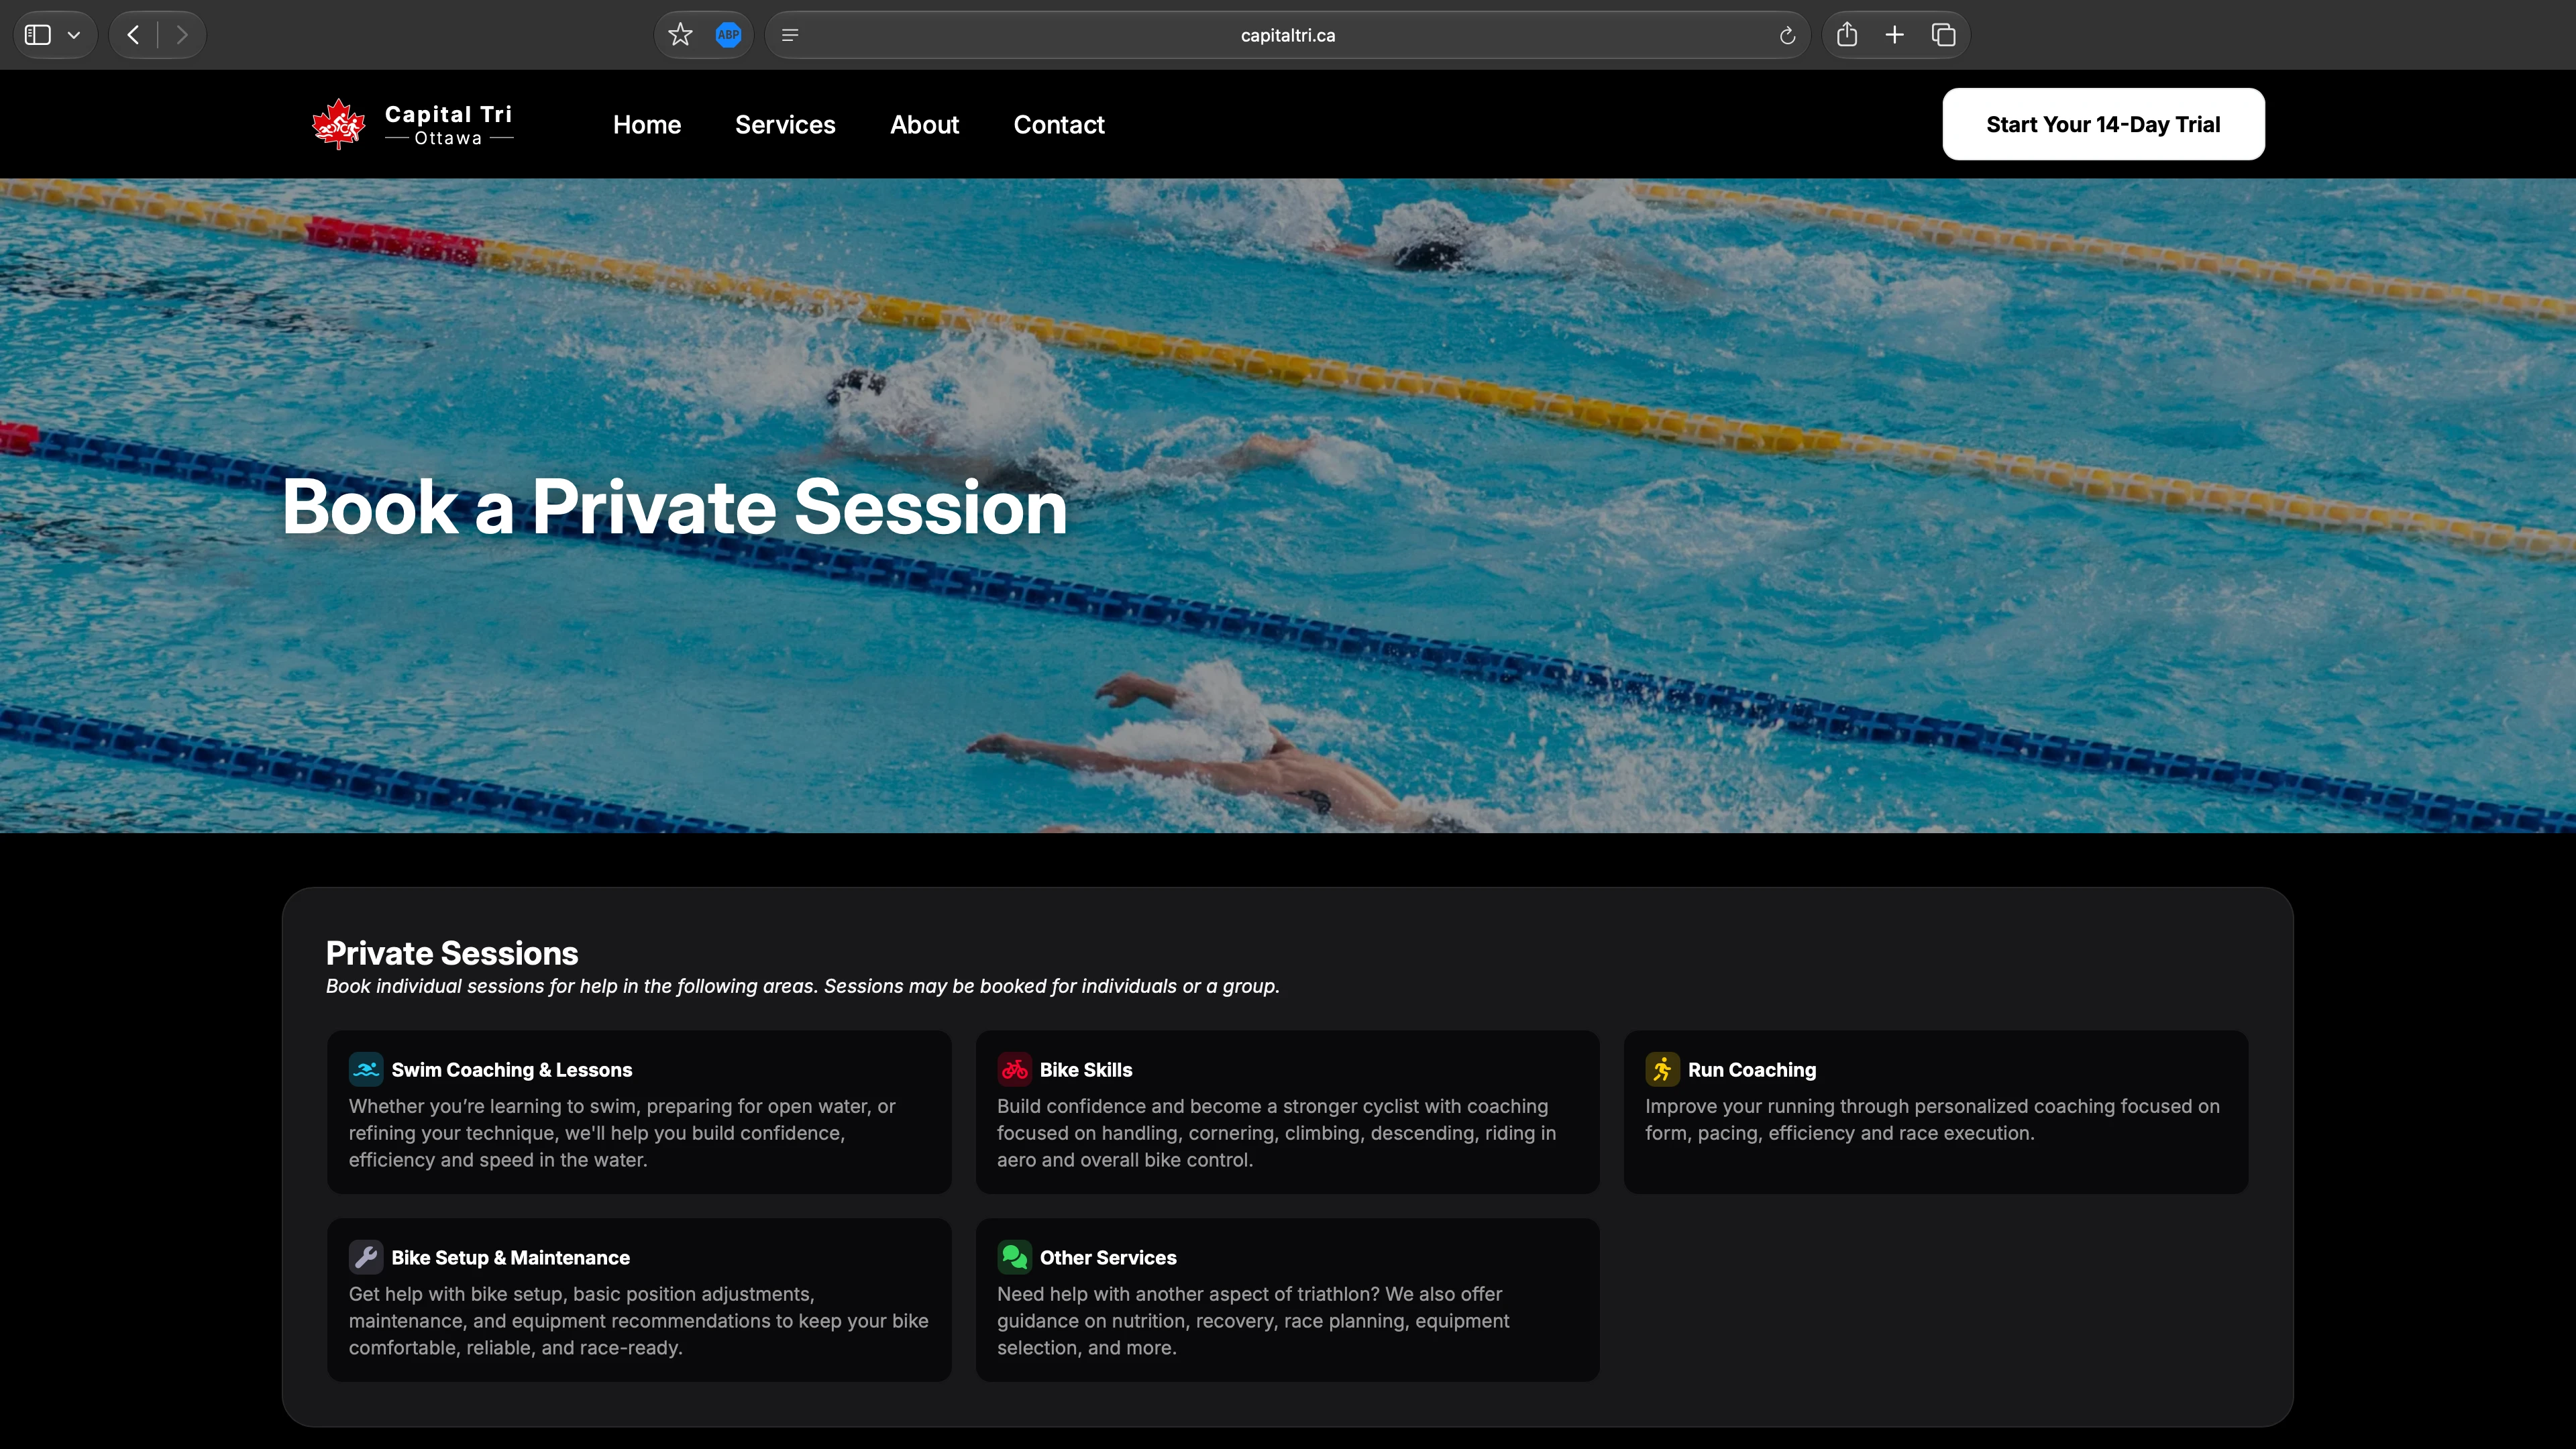
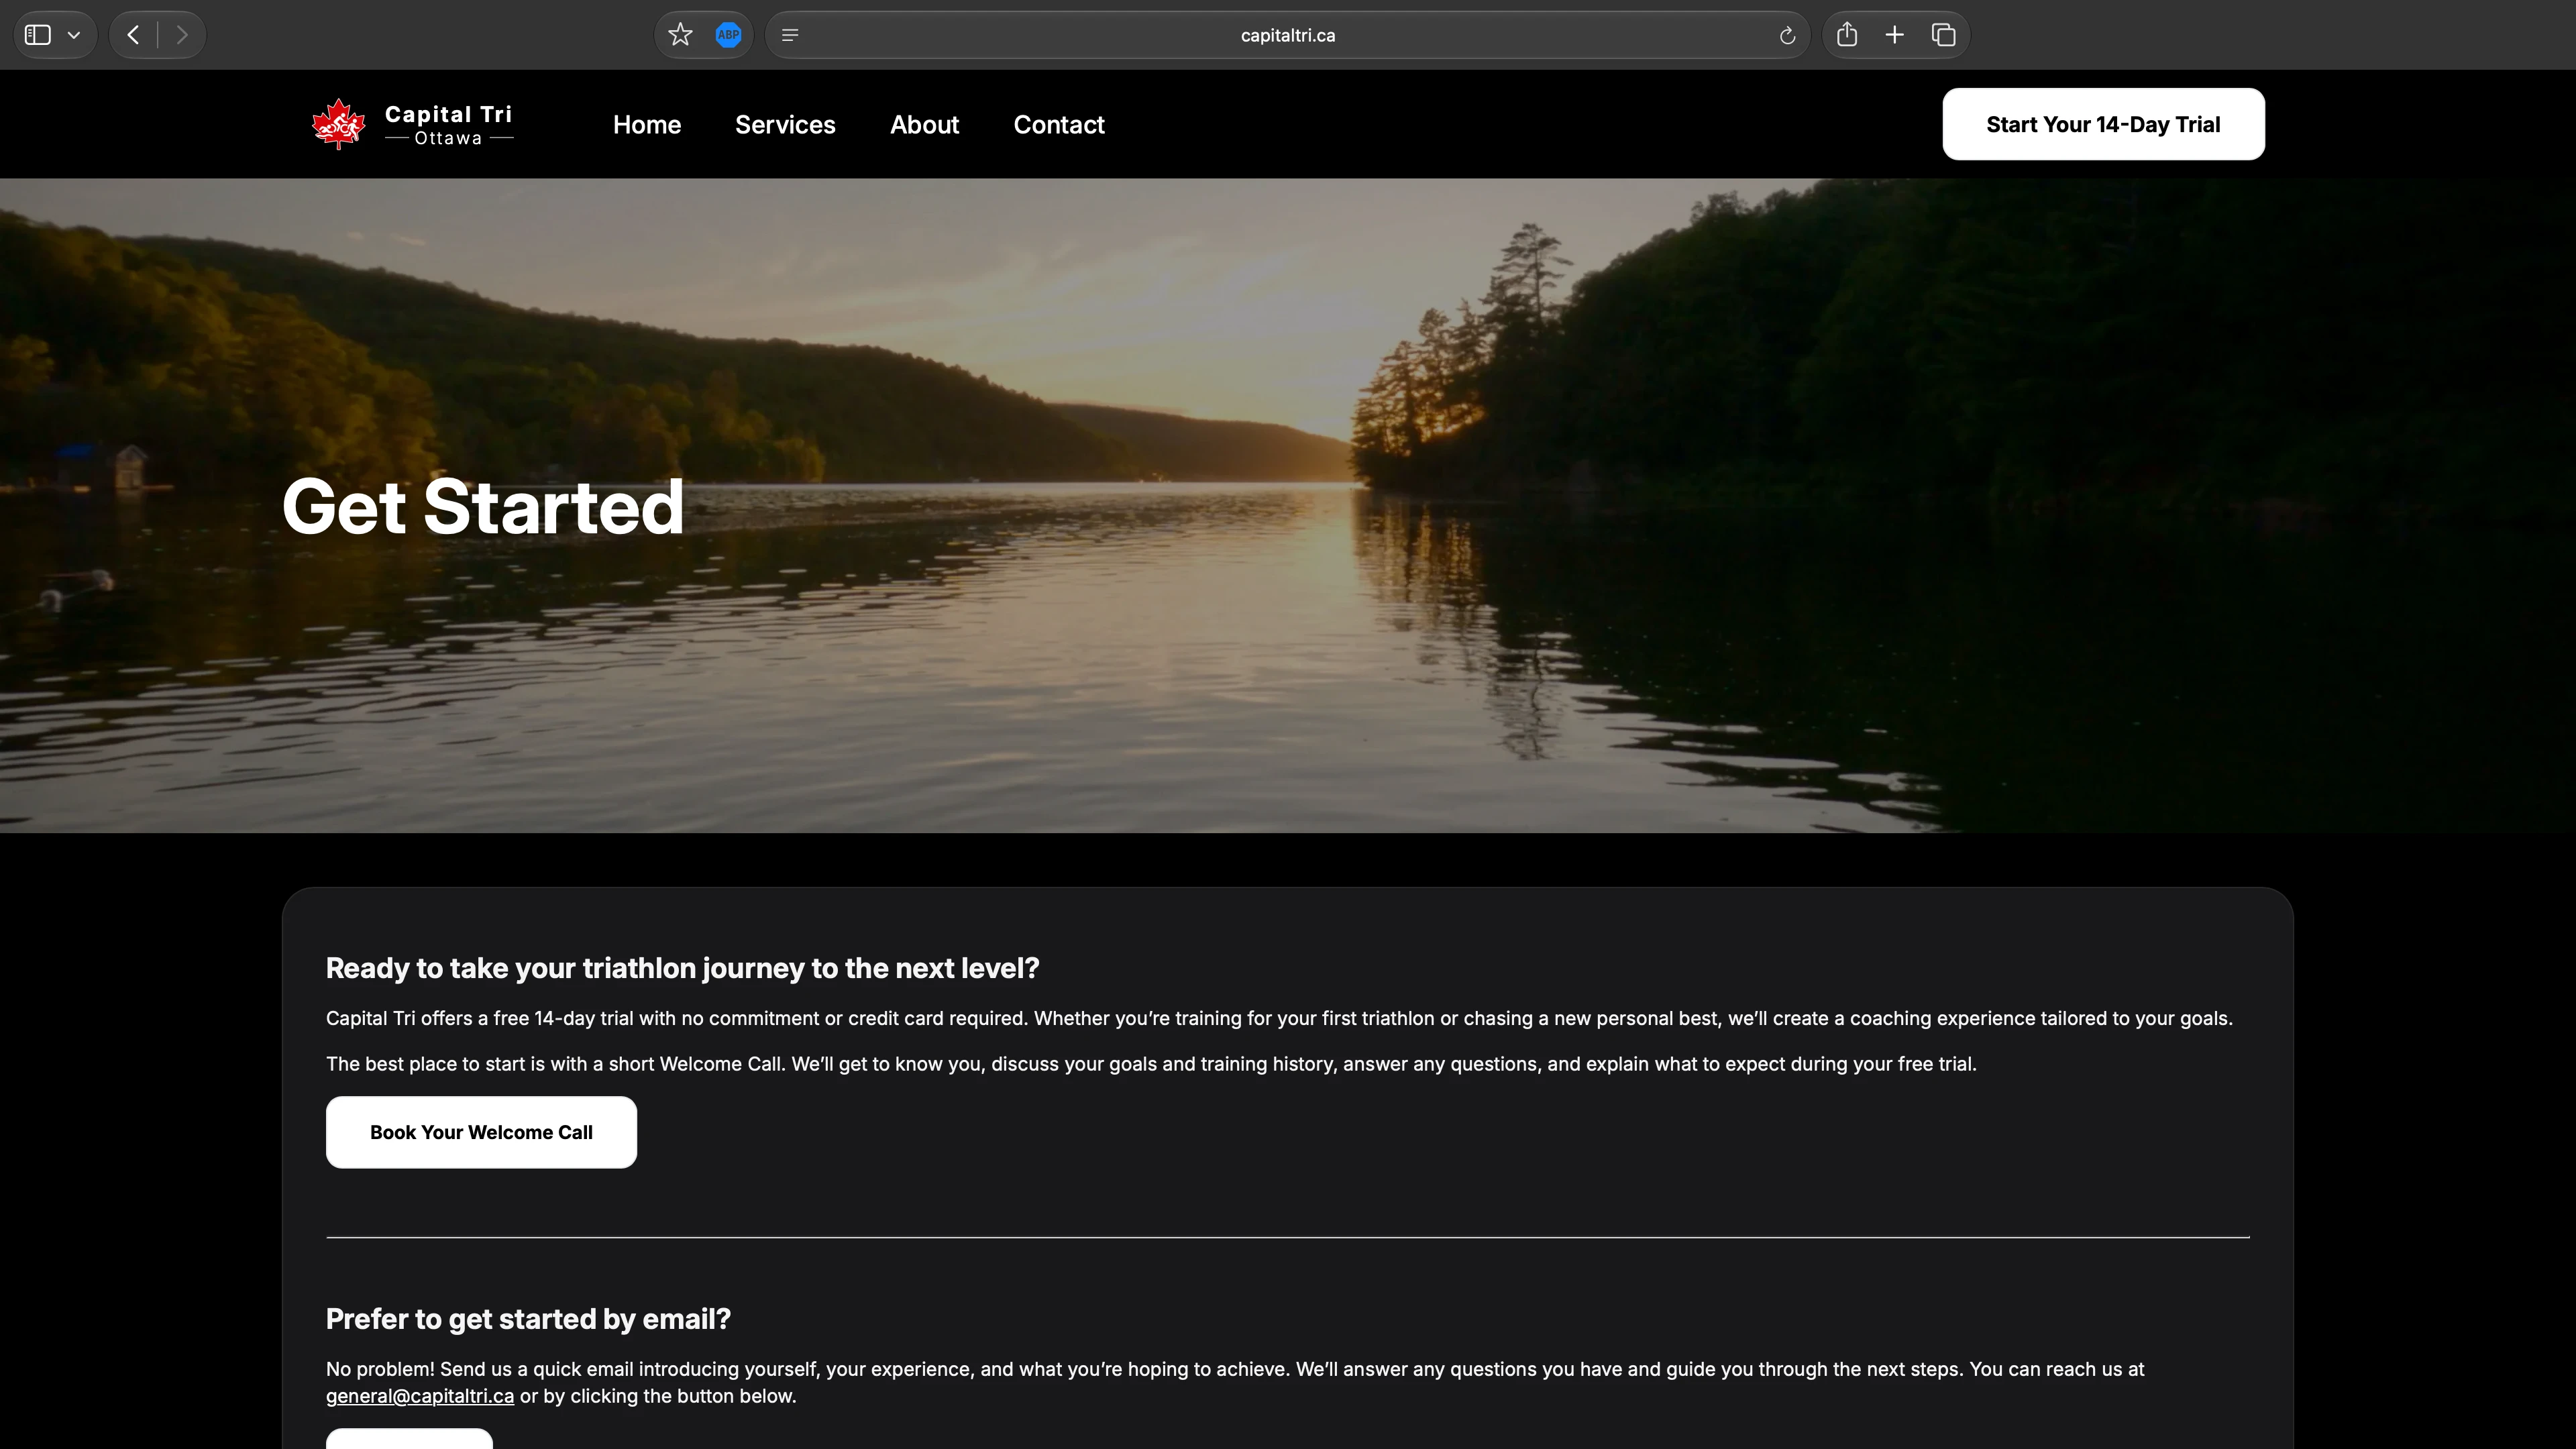
Capital Tri
Capital Tri is a triathlon coaching website I designed and developed from the ground up using Next.js, taking the project from initial concept through design, development and production deployment. Creating the complete visual identity and user experience went hand-in-hand with building a reusable component system and fully responsive layouts, providing a consistent experience across devices. Accessibility was a major focus throughout development, with Lighthouse testing used alongside optimized imagery and modern web development practices to ensure a fast, accessible and polished experience for everyone.
- Next.js
- React
- JavaScript
- HTML
- CSS
- Pixelmator Pro
- Google Analytics

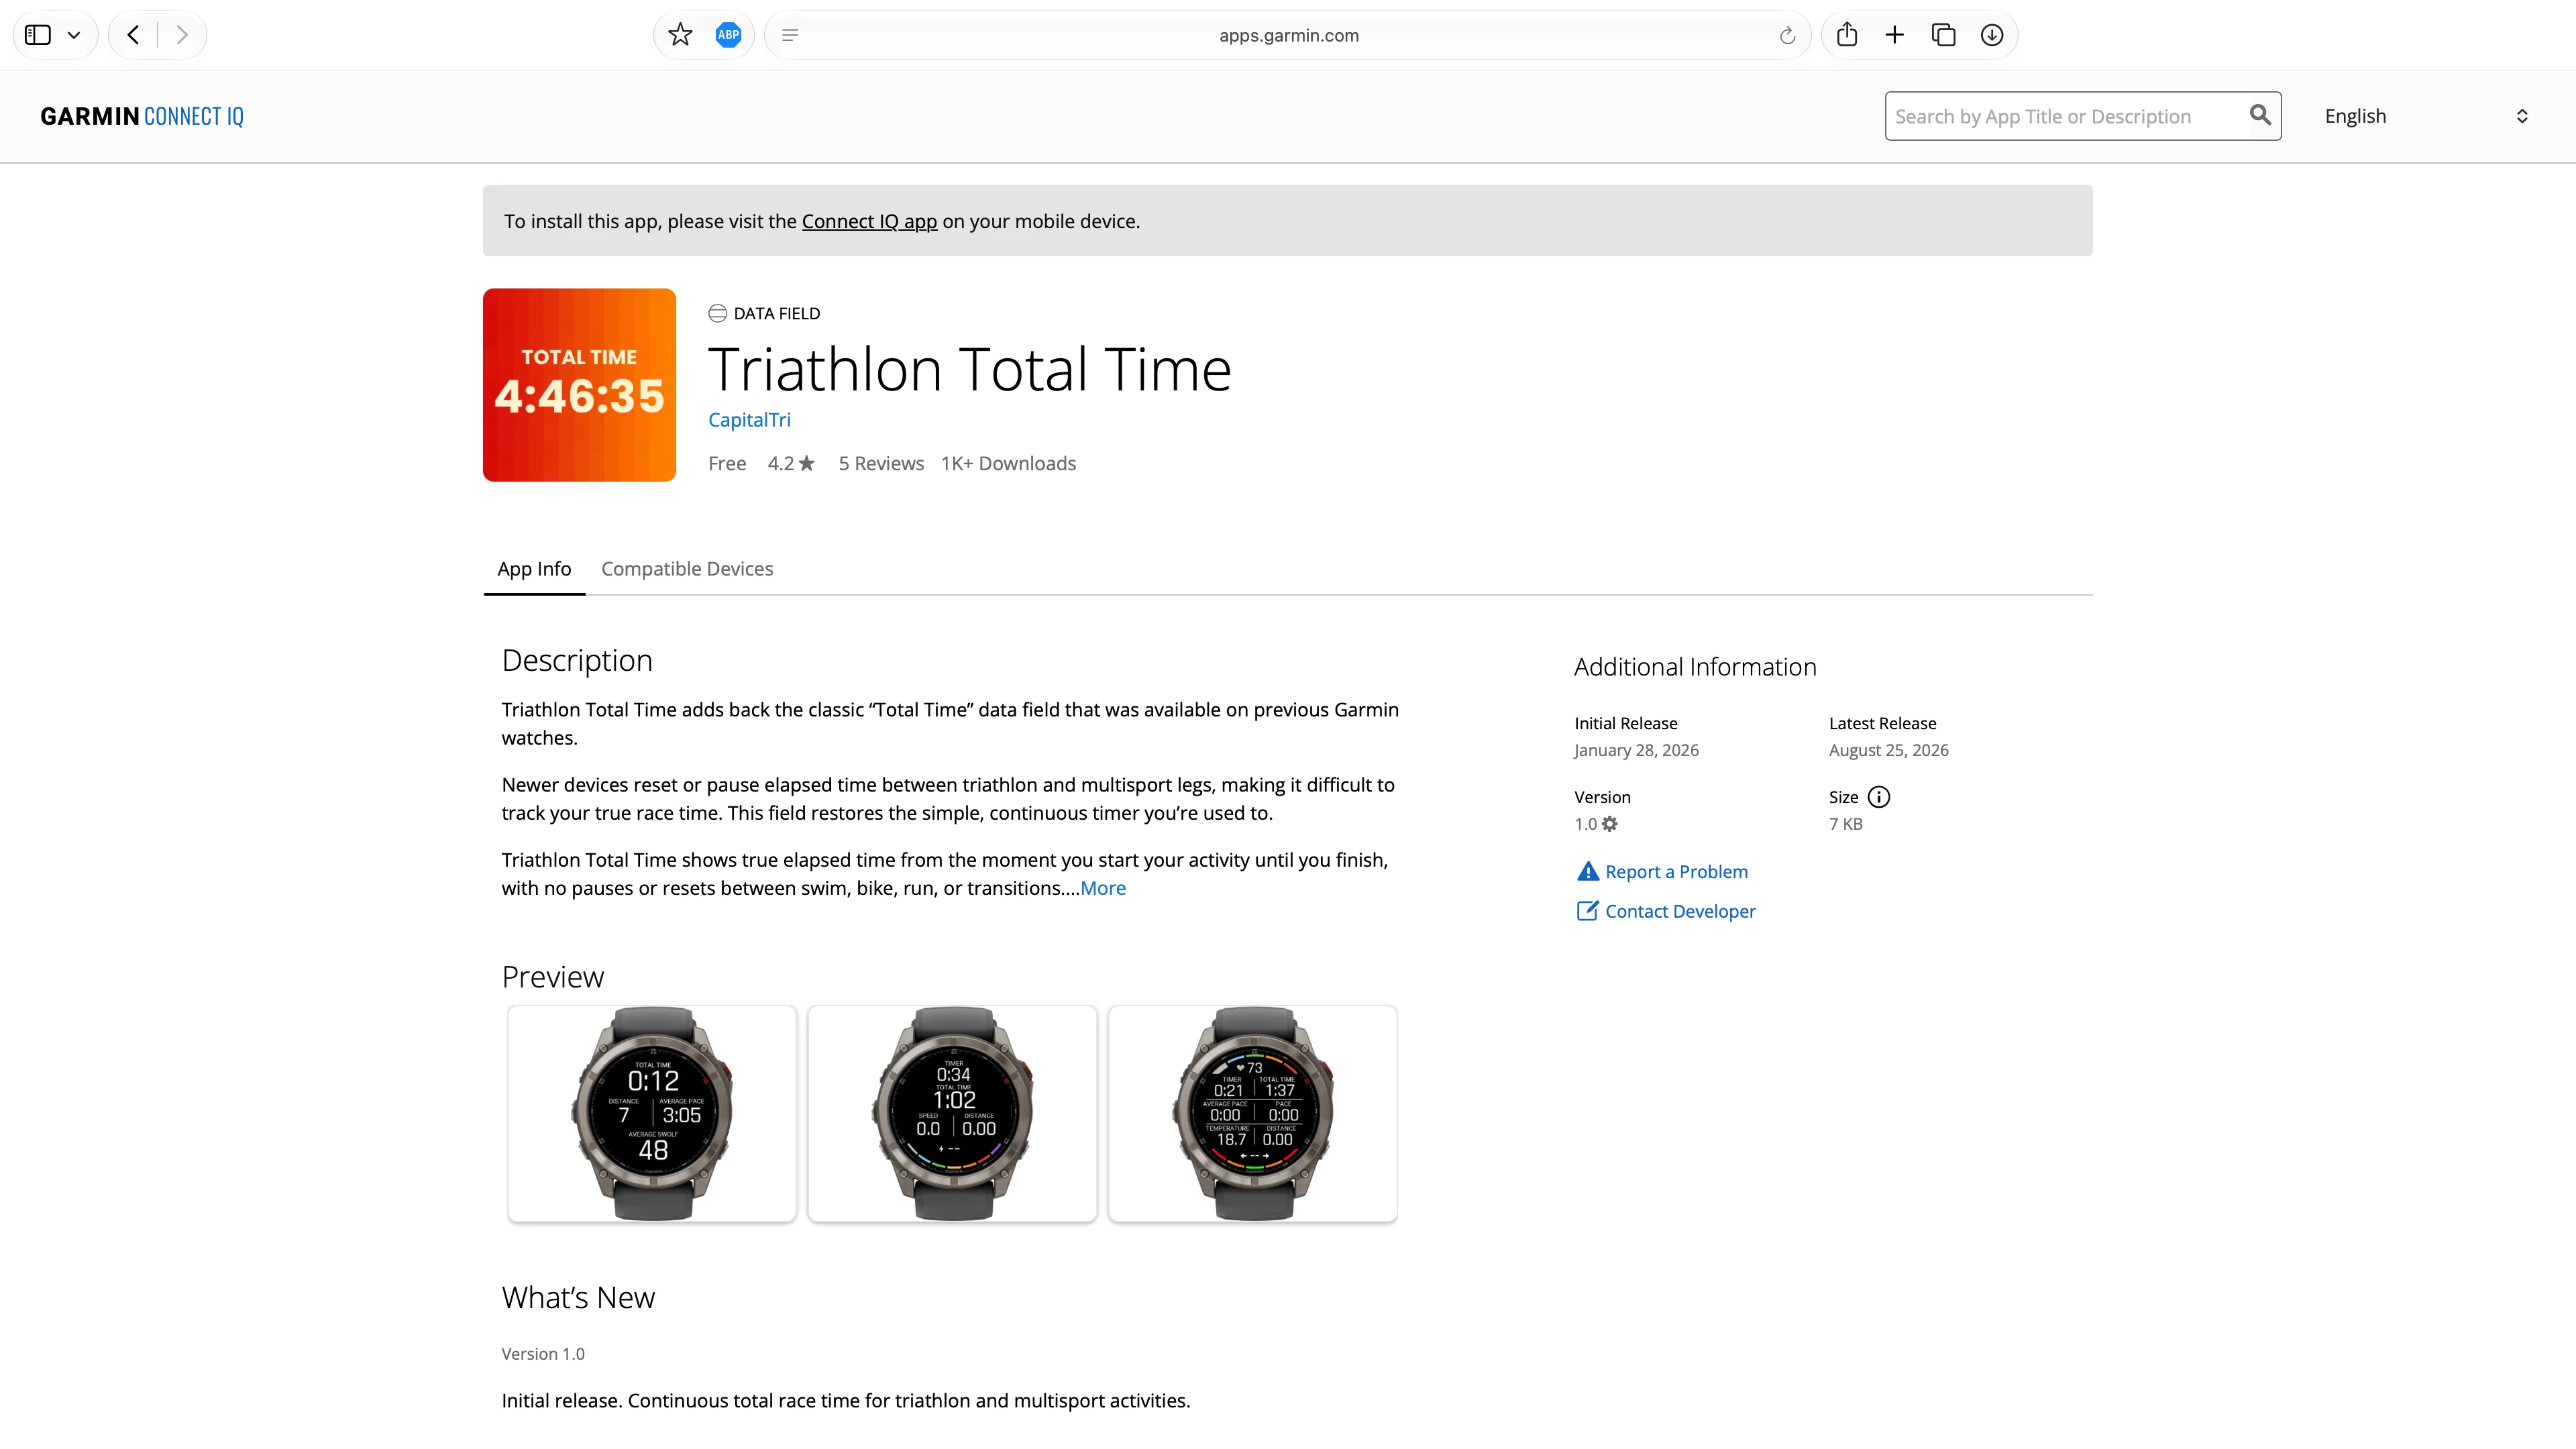
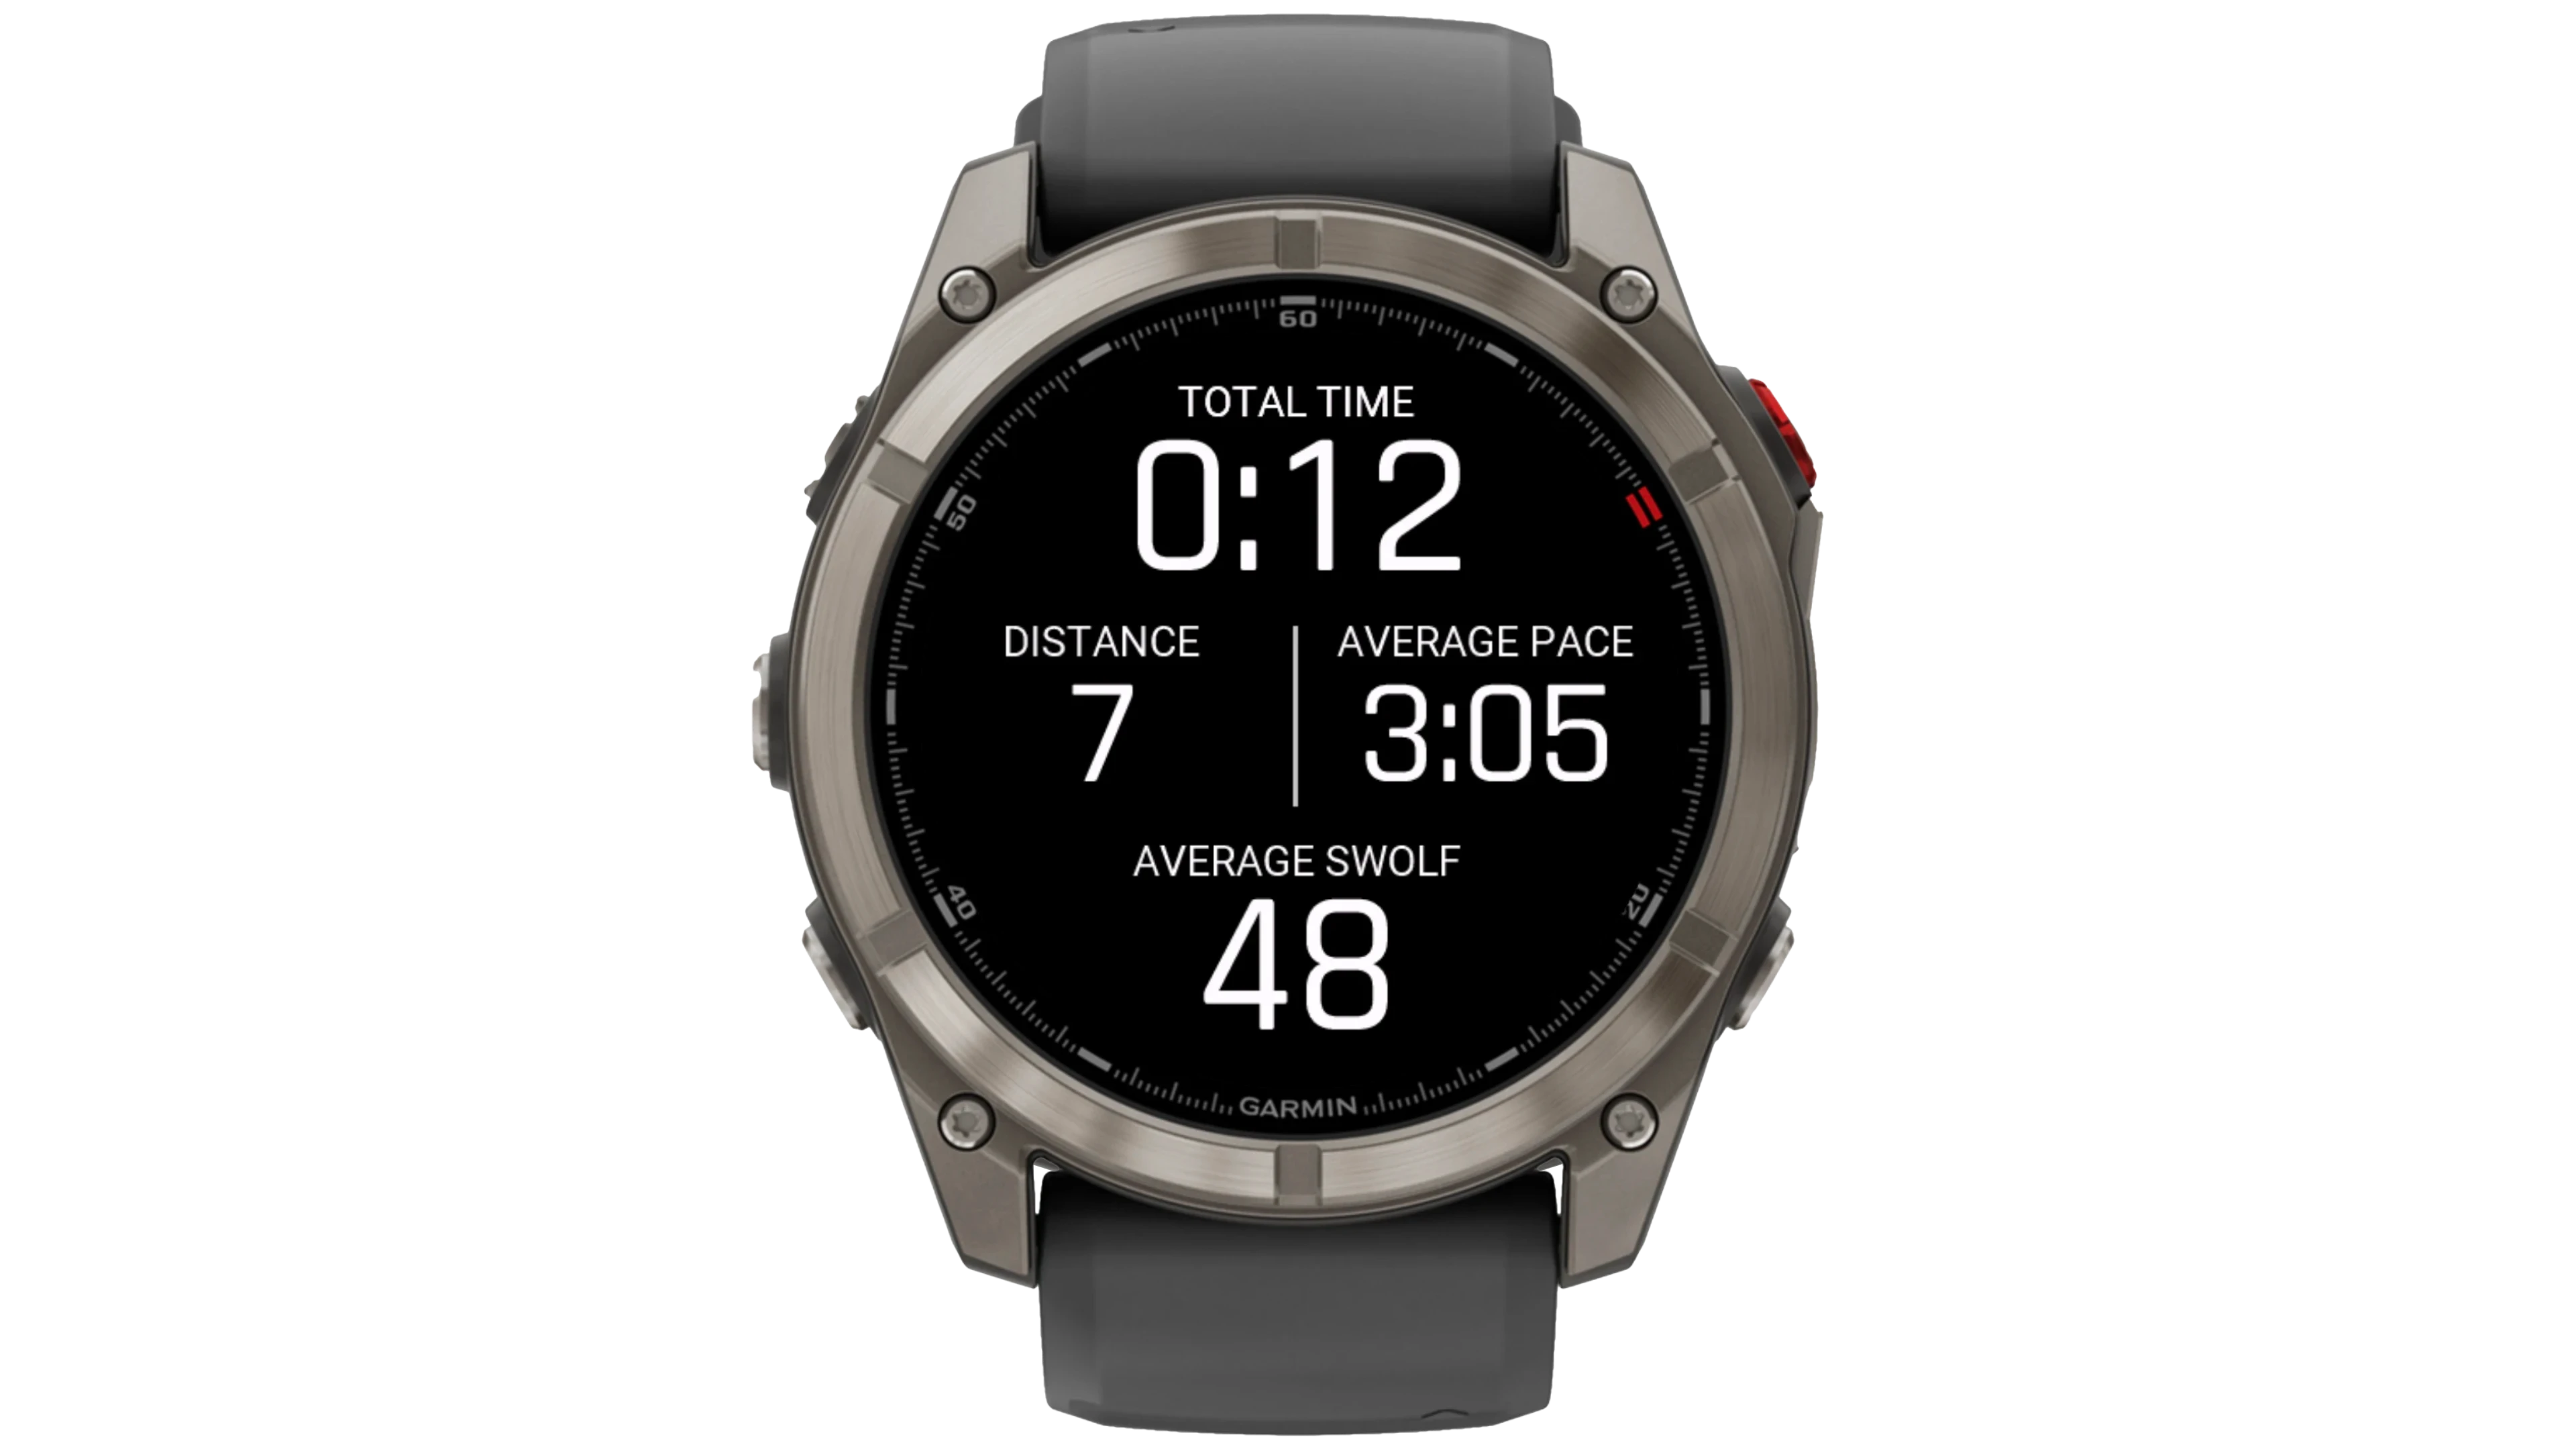
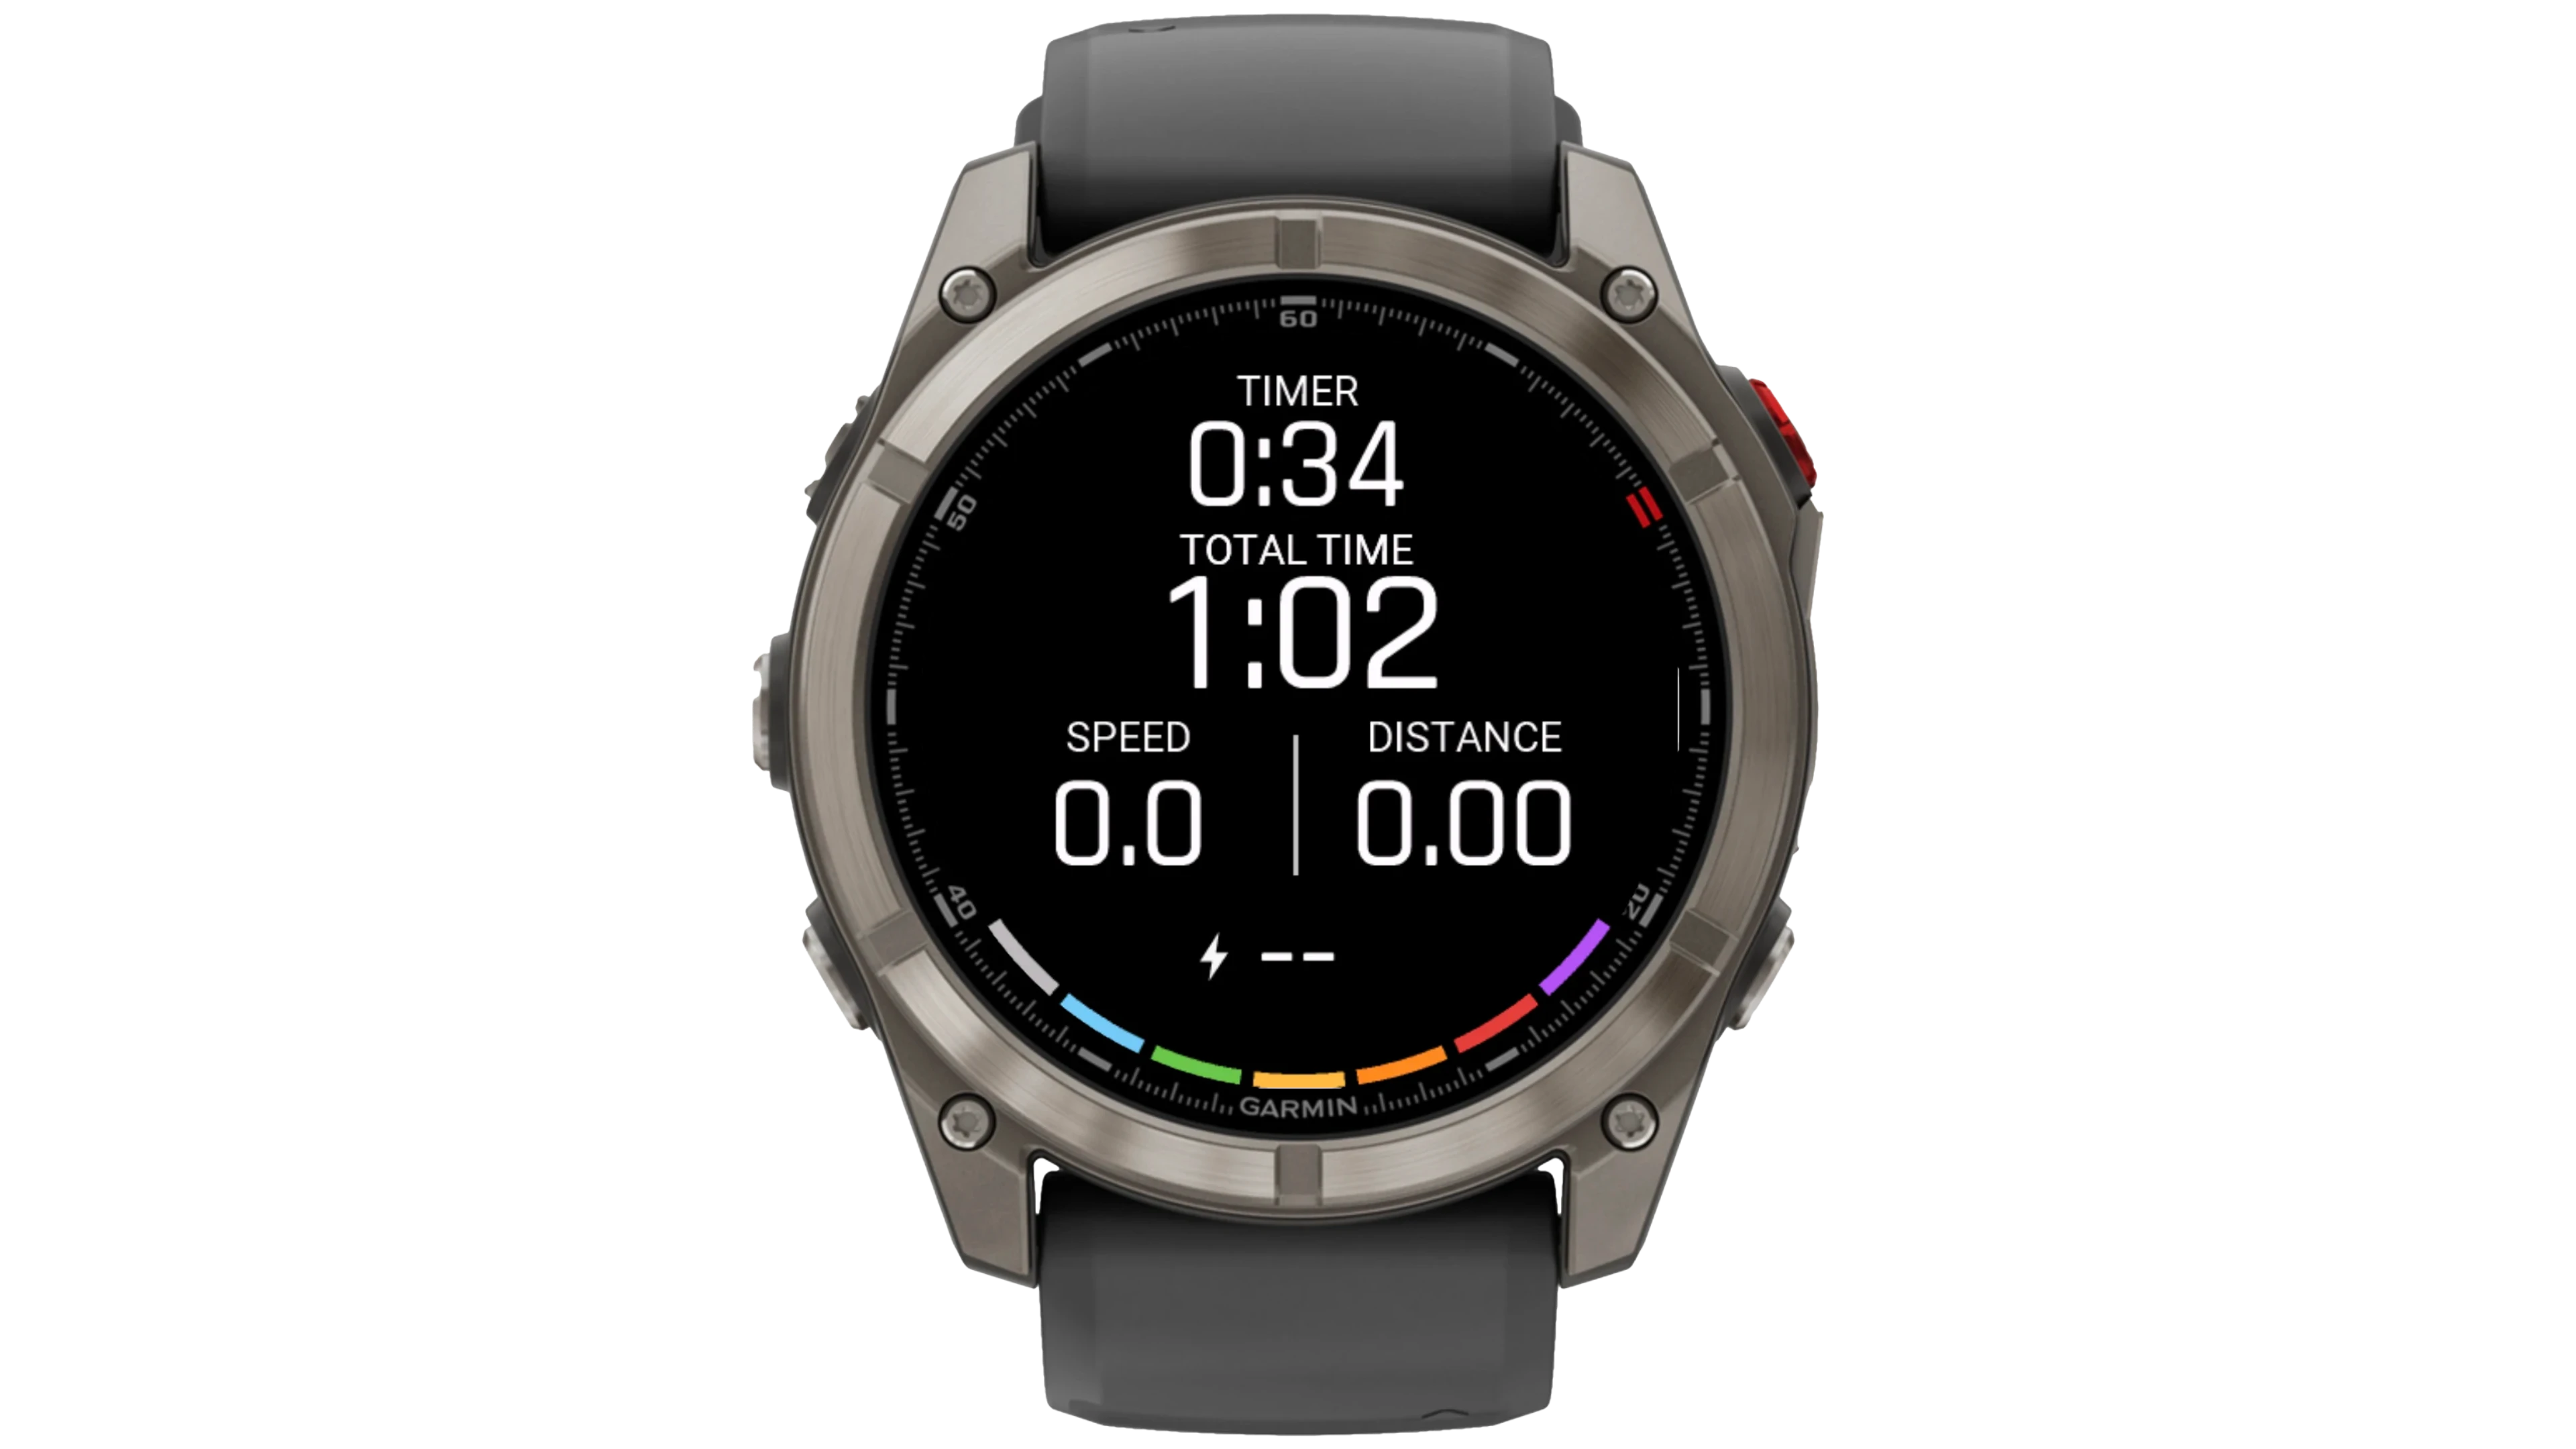
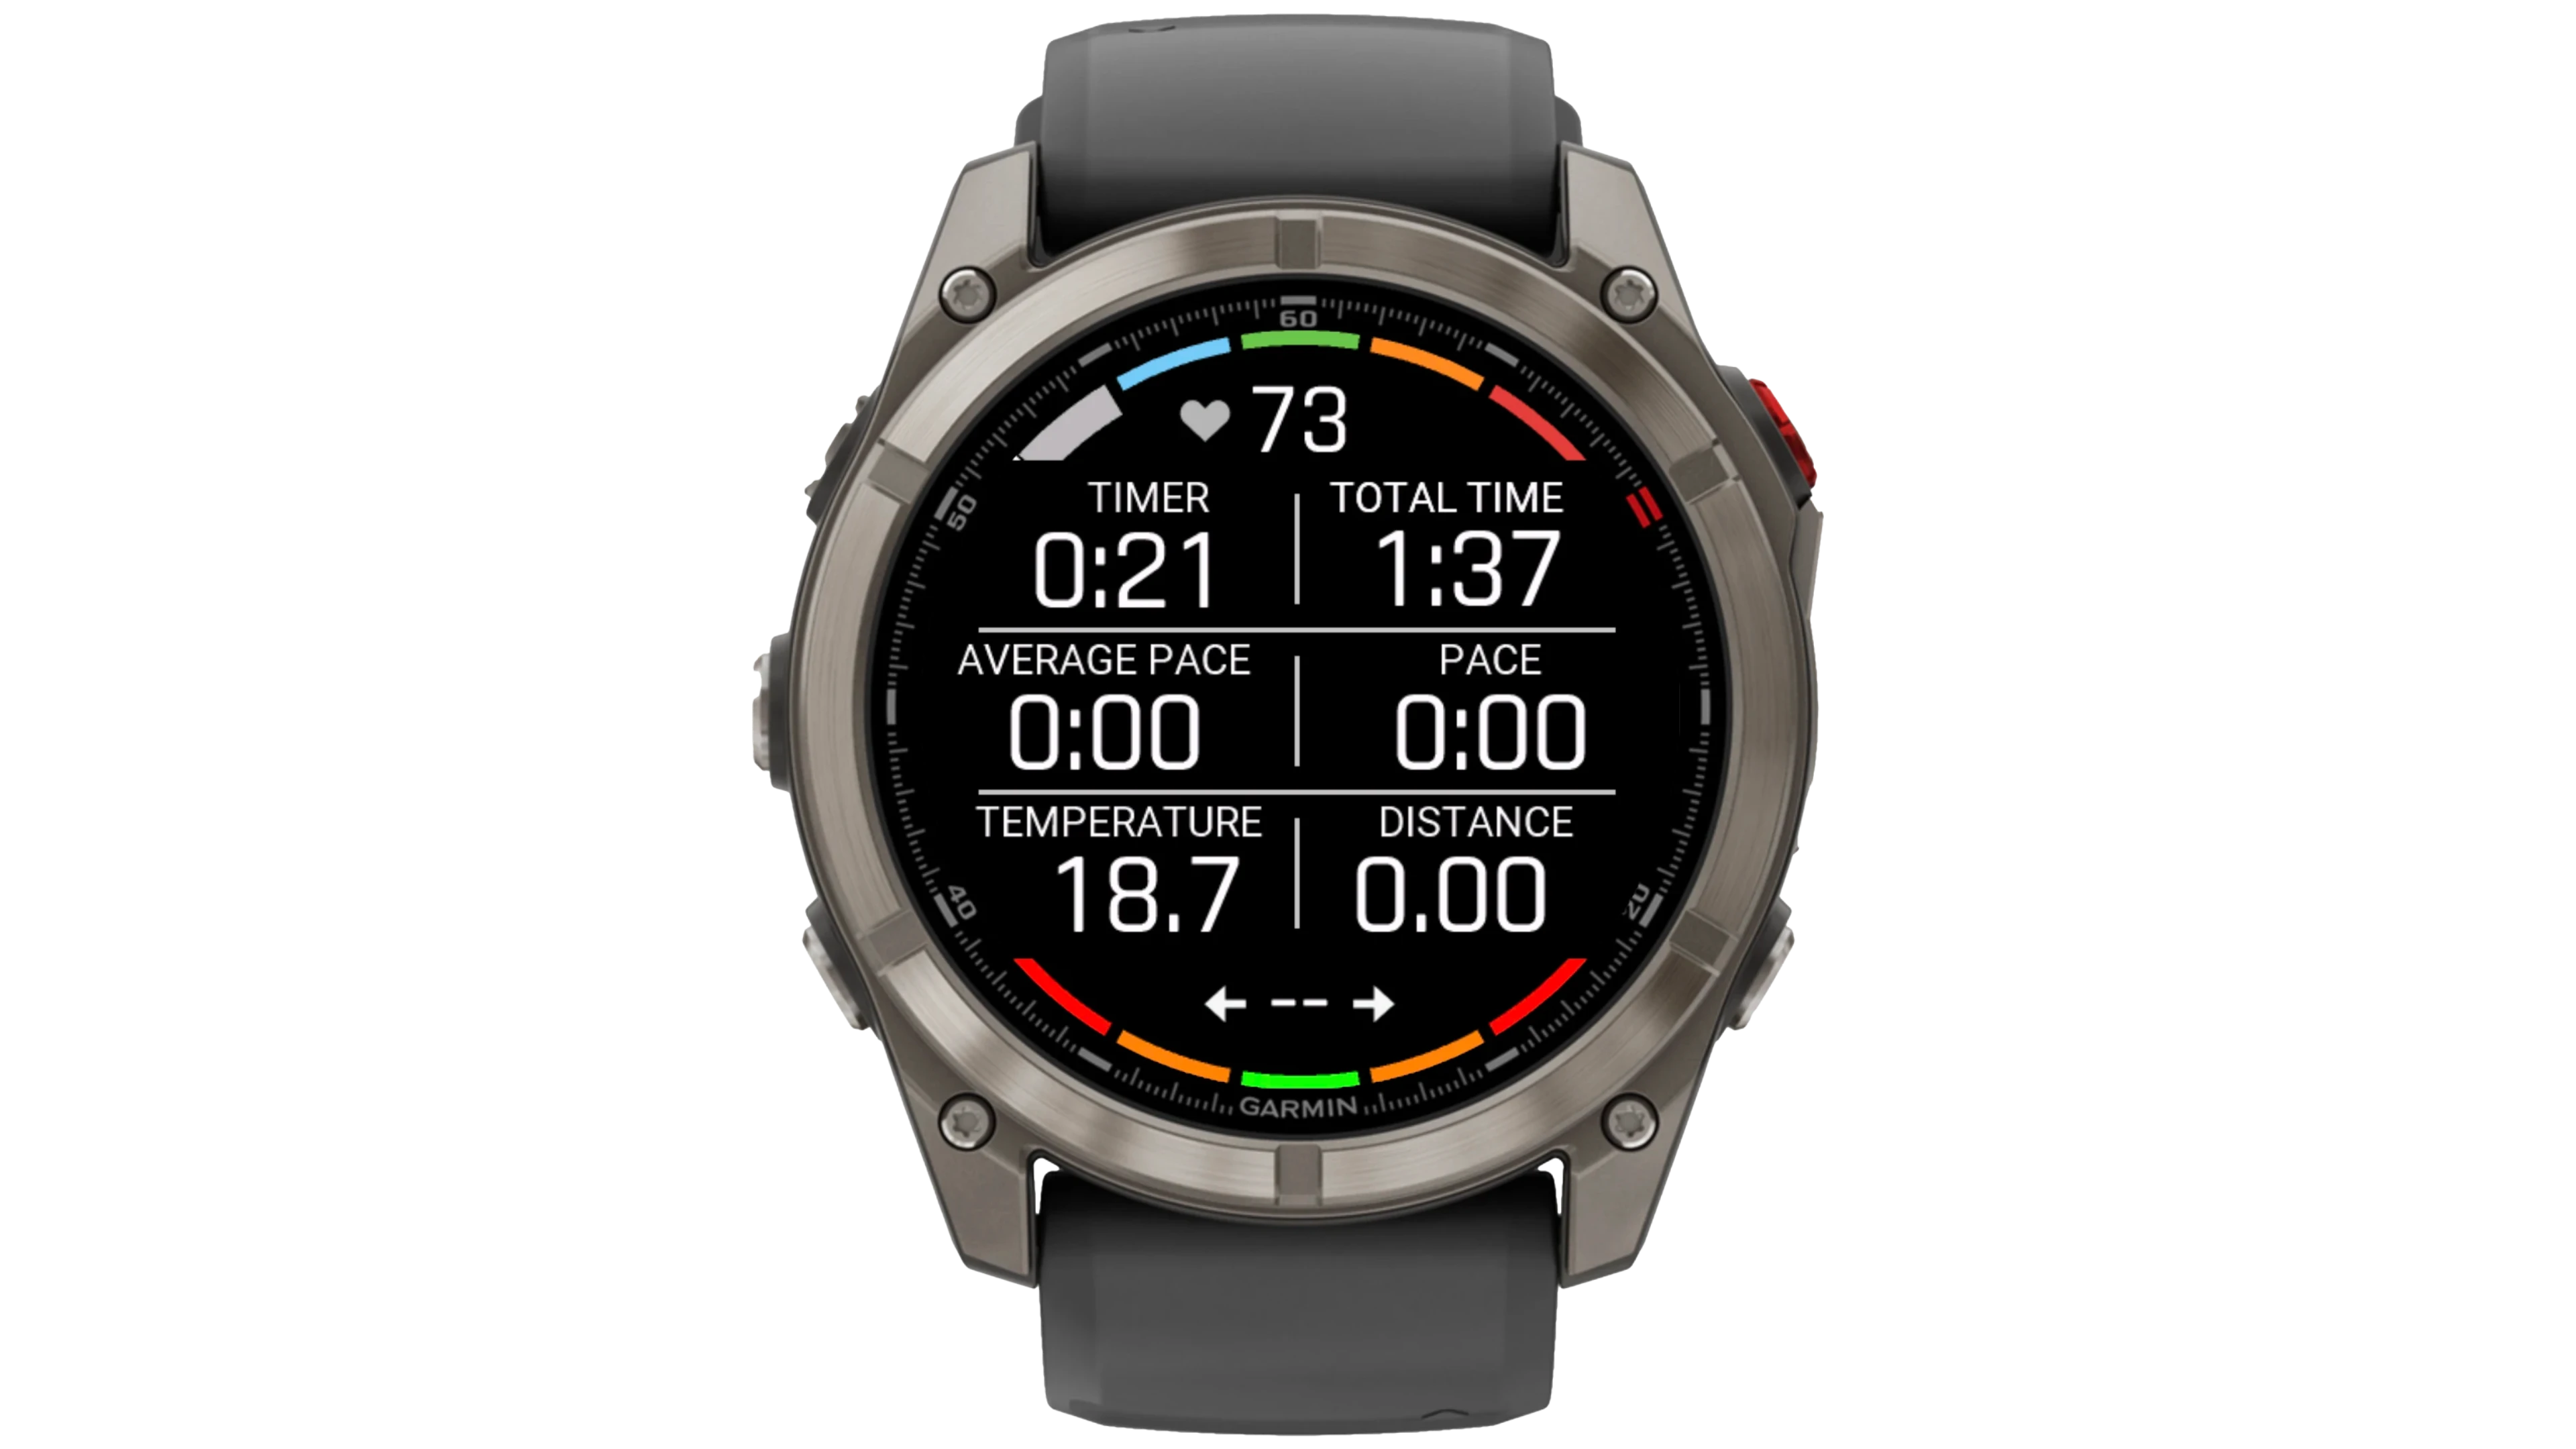
Triathlon Total Time
Triathlon Total Time is a Garmin Connect IQ data field I developed to solve a problem I encountered while racing. Newer Garmin watches no longer offered the total-time data field I relied on during triathlons, requiring me to switch screens or press buttons to see my overall race time. With no previous experience or familiarity with Monkey C, the project meant learning the language and Connect IQ platform from scratch, with the first working version completed that same day. The resulting data field provides a continuous view of total race time across each discipline and transition, and has since surpassed 1,000 downloads on the Connect IQ Store.
 Monkey C
- Pixelmator Pro


GC-Tortilla
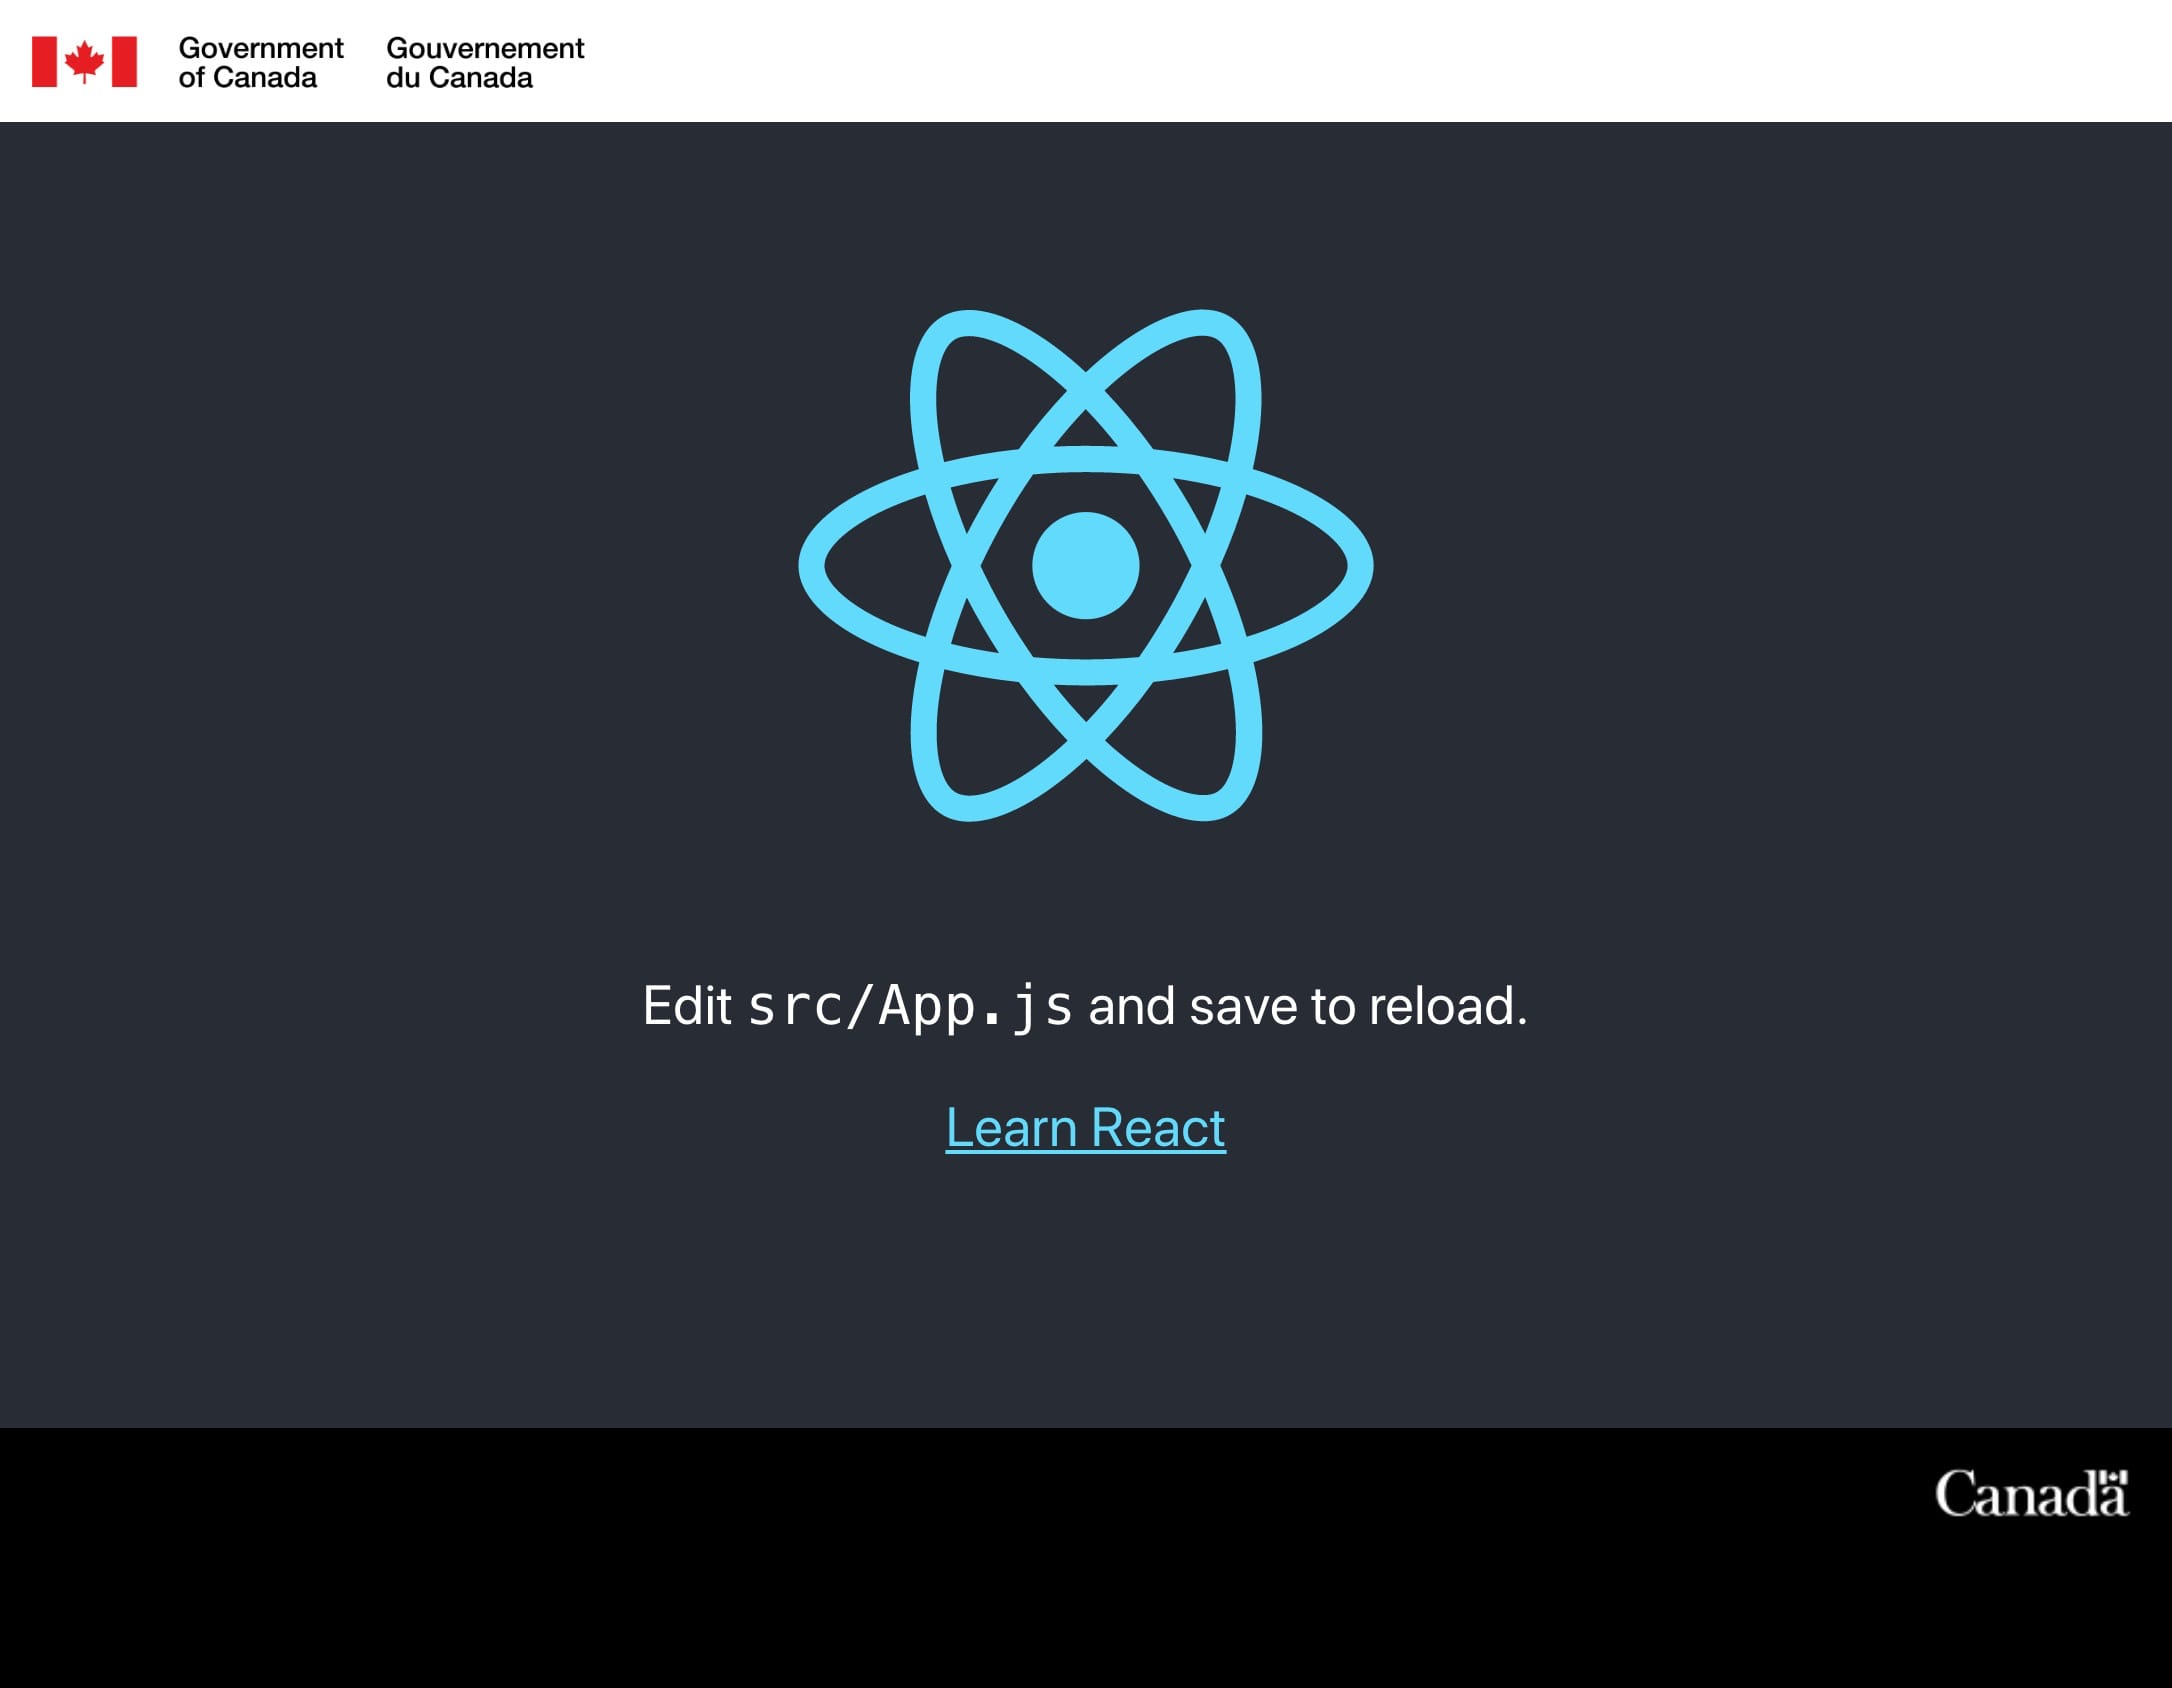
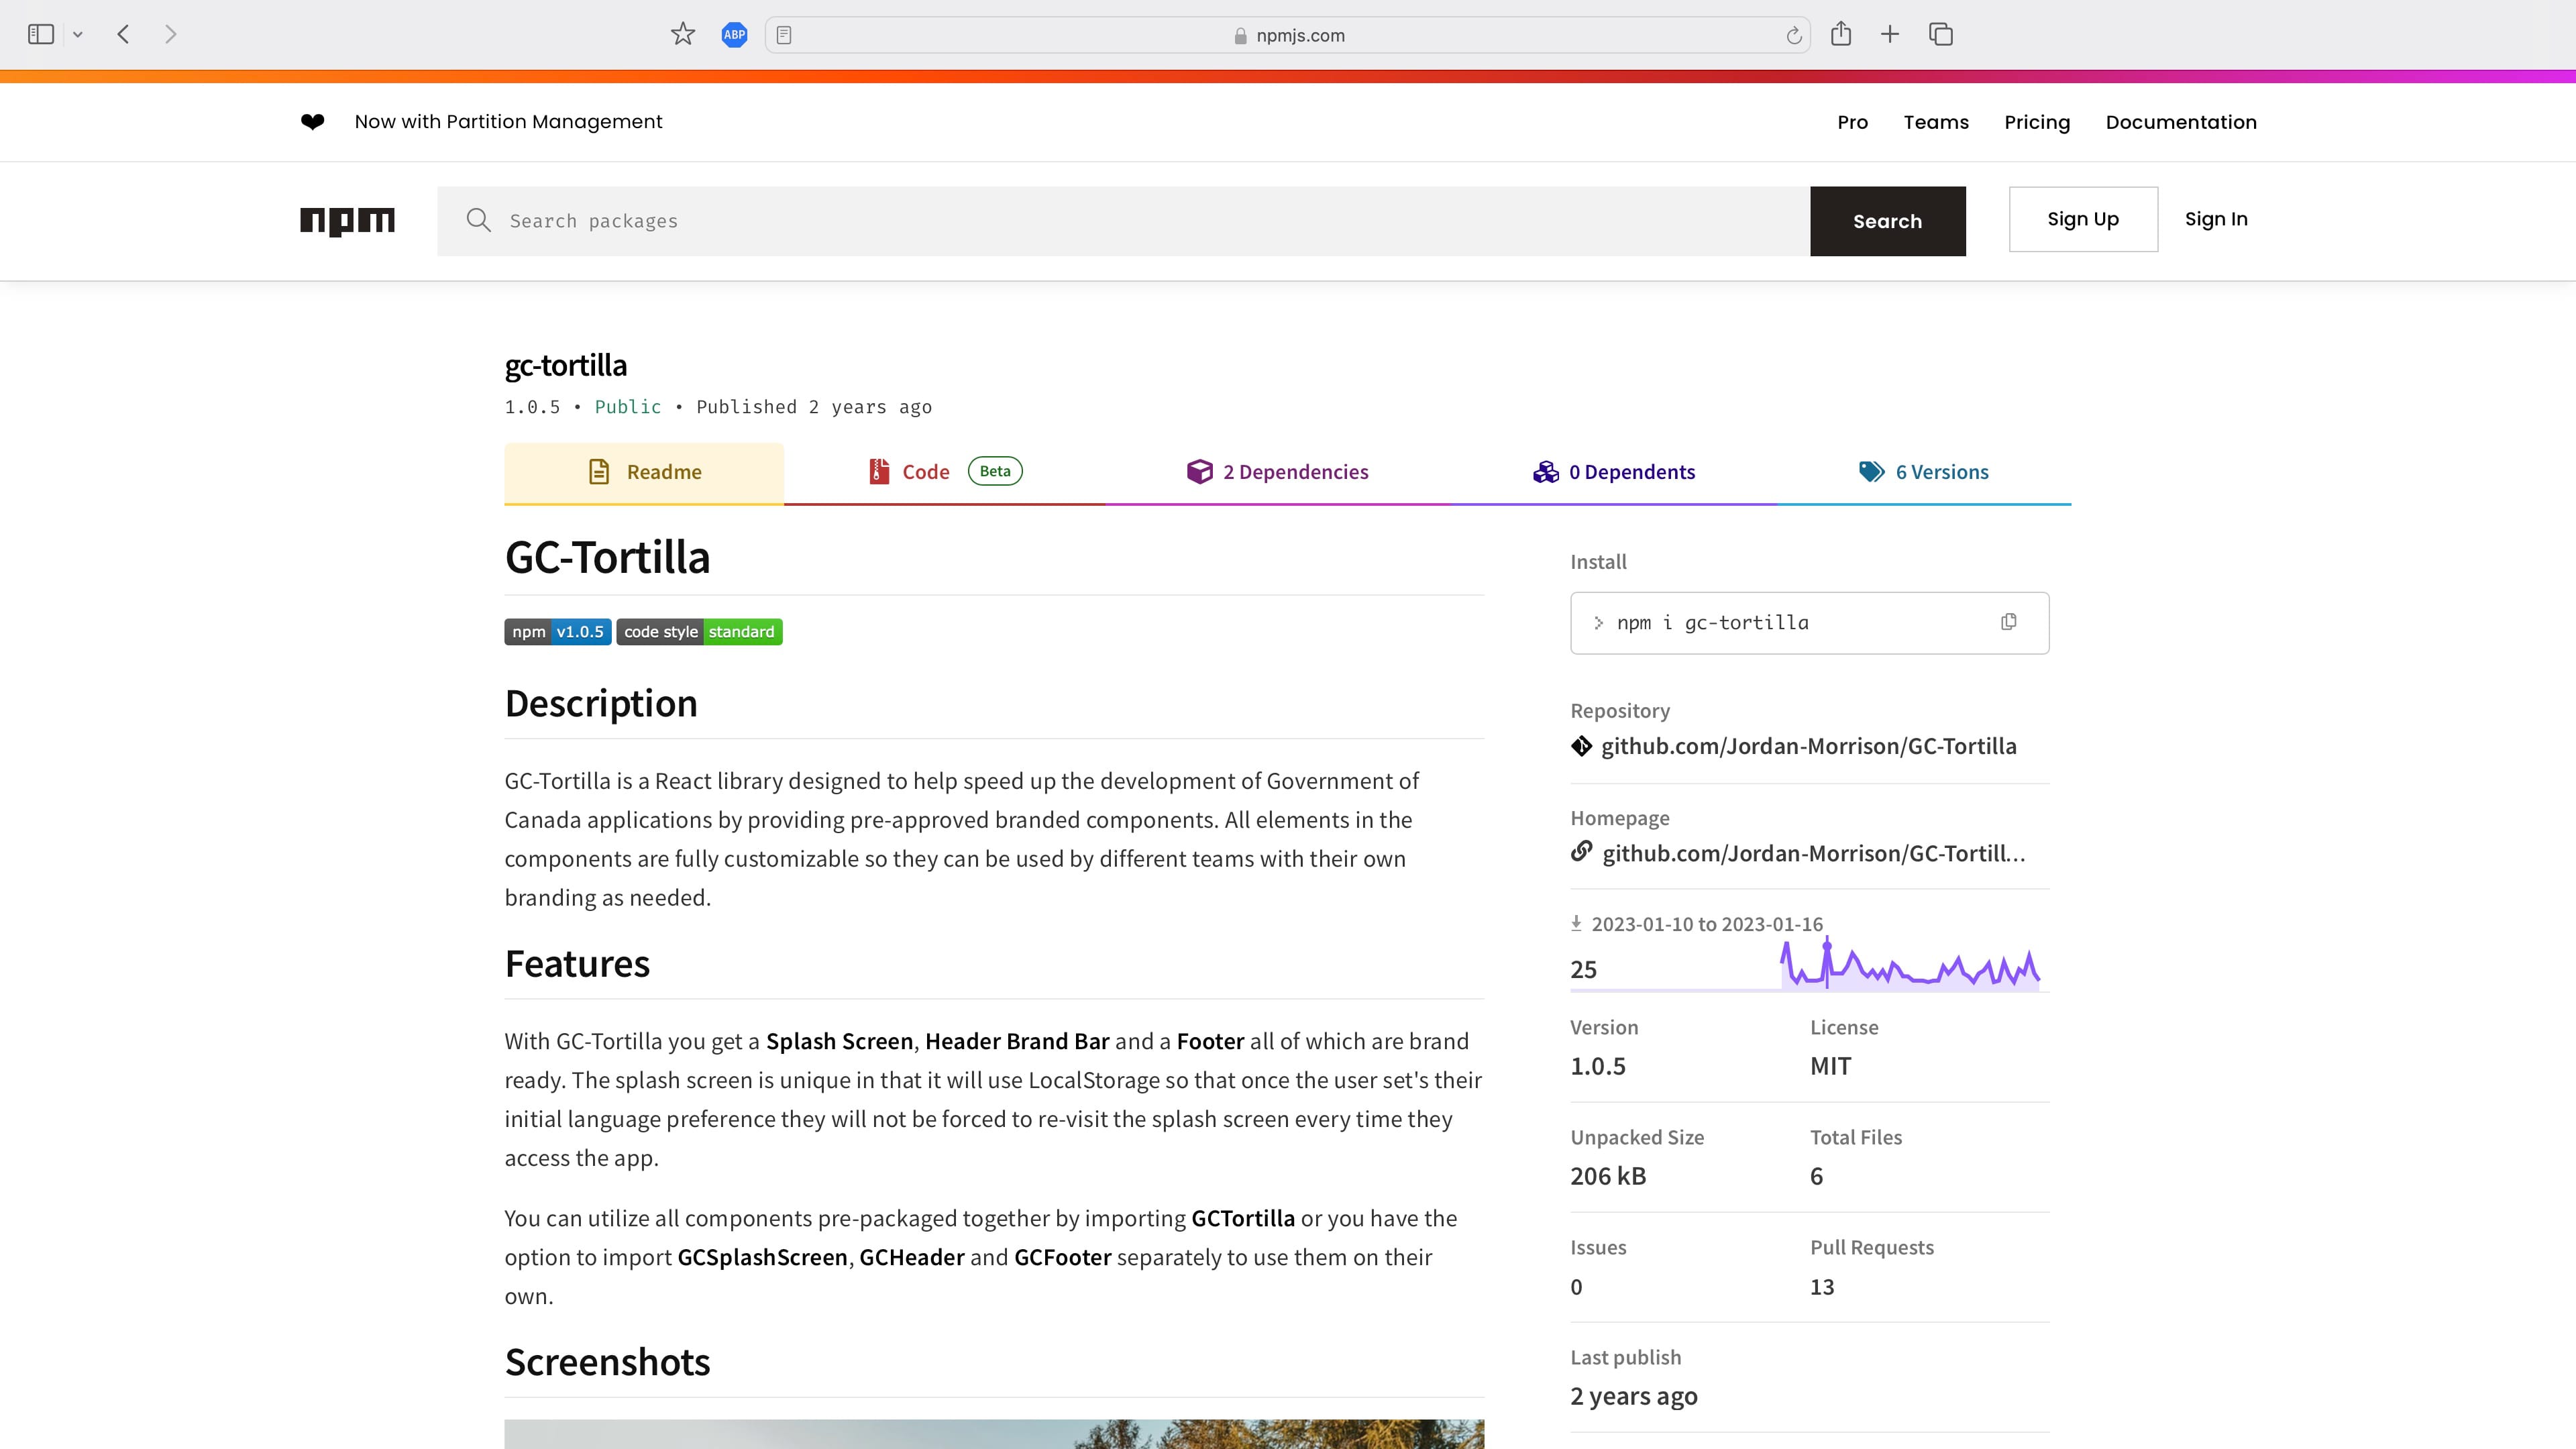
GC-Tortilla is a React library designed to help speed up the development of Government of Canada applications by providing pre-approved branded components. All elements in the components are fully customizable so they can be used by different teams with their own branding as needed. With GC-Tortilla you get a Splash Screen, Header Brand Bar and a Footer all of which are brand ready. The splash screen is unique in that it will use LocalStorage so that once the user set's their initial language preference they will not be forced to re-visit the splash screen every time they access the app. You can utilize all components pre-packaged together by importing GC-Tortilla or you have the option to import GCSplashScreen, GCHeader and GCFooter separately to use them on their own. This library is hosted on NPM and showcases my ability to write clear & concise documentation.
- React
- JavaScript
- Node.js
- HTML
- CSS
Open Call
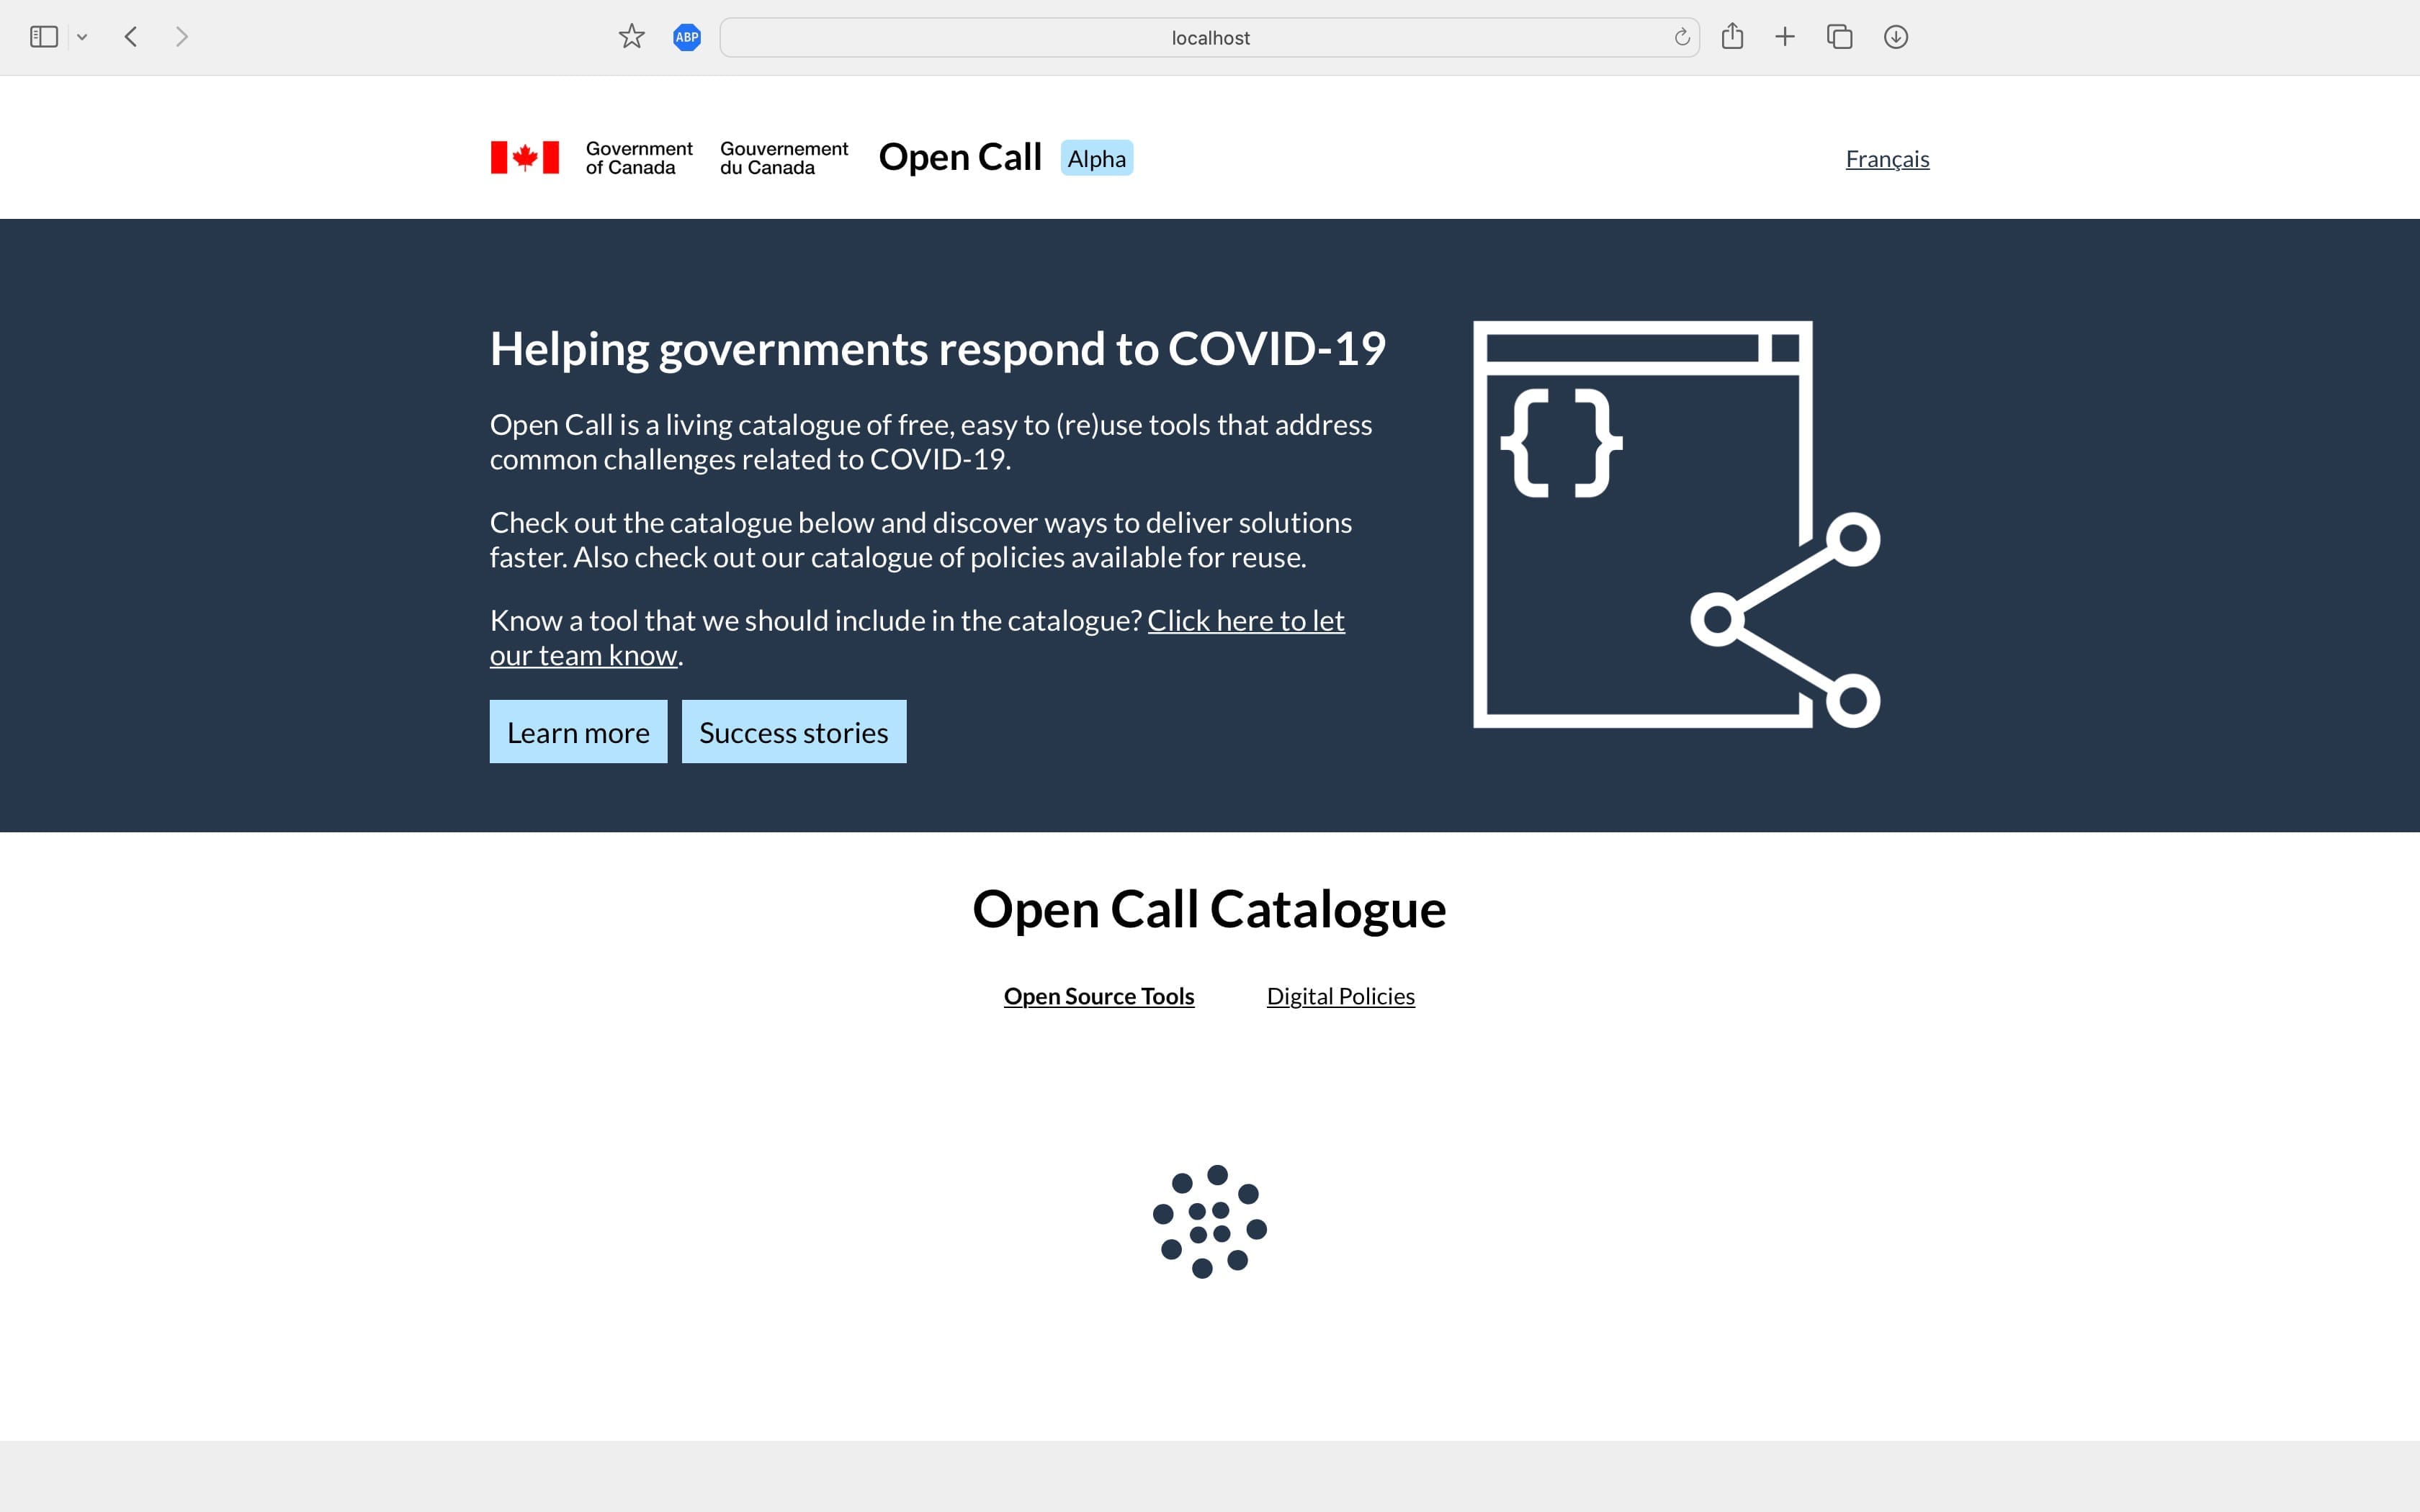
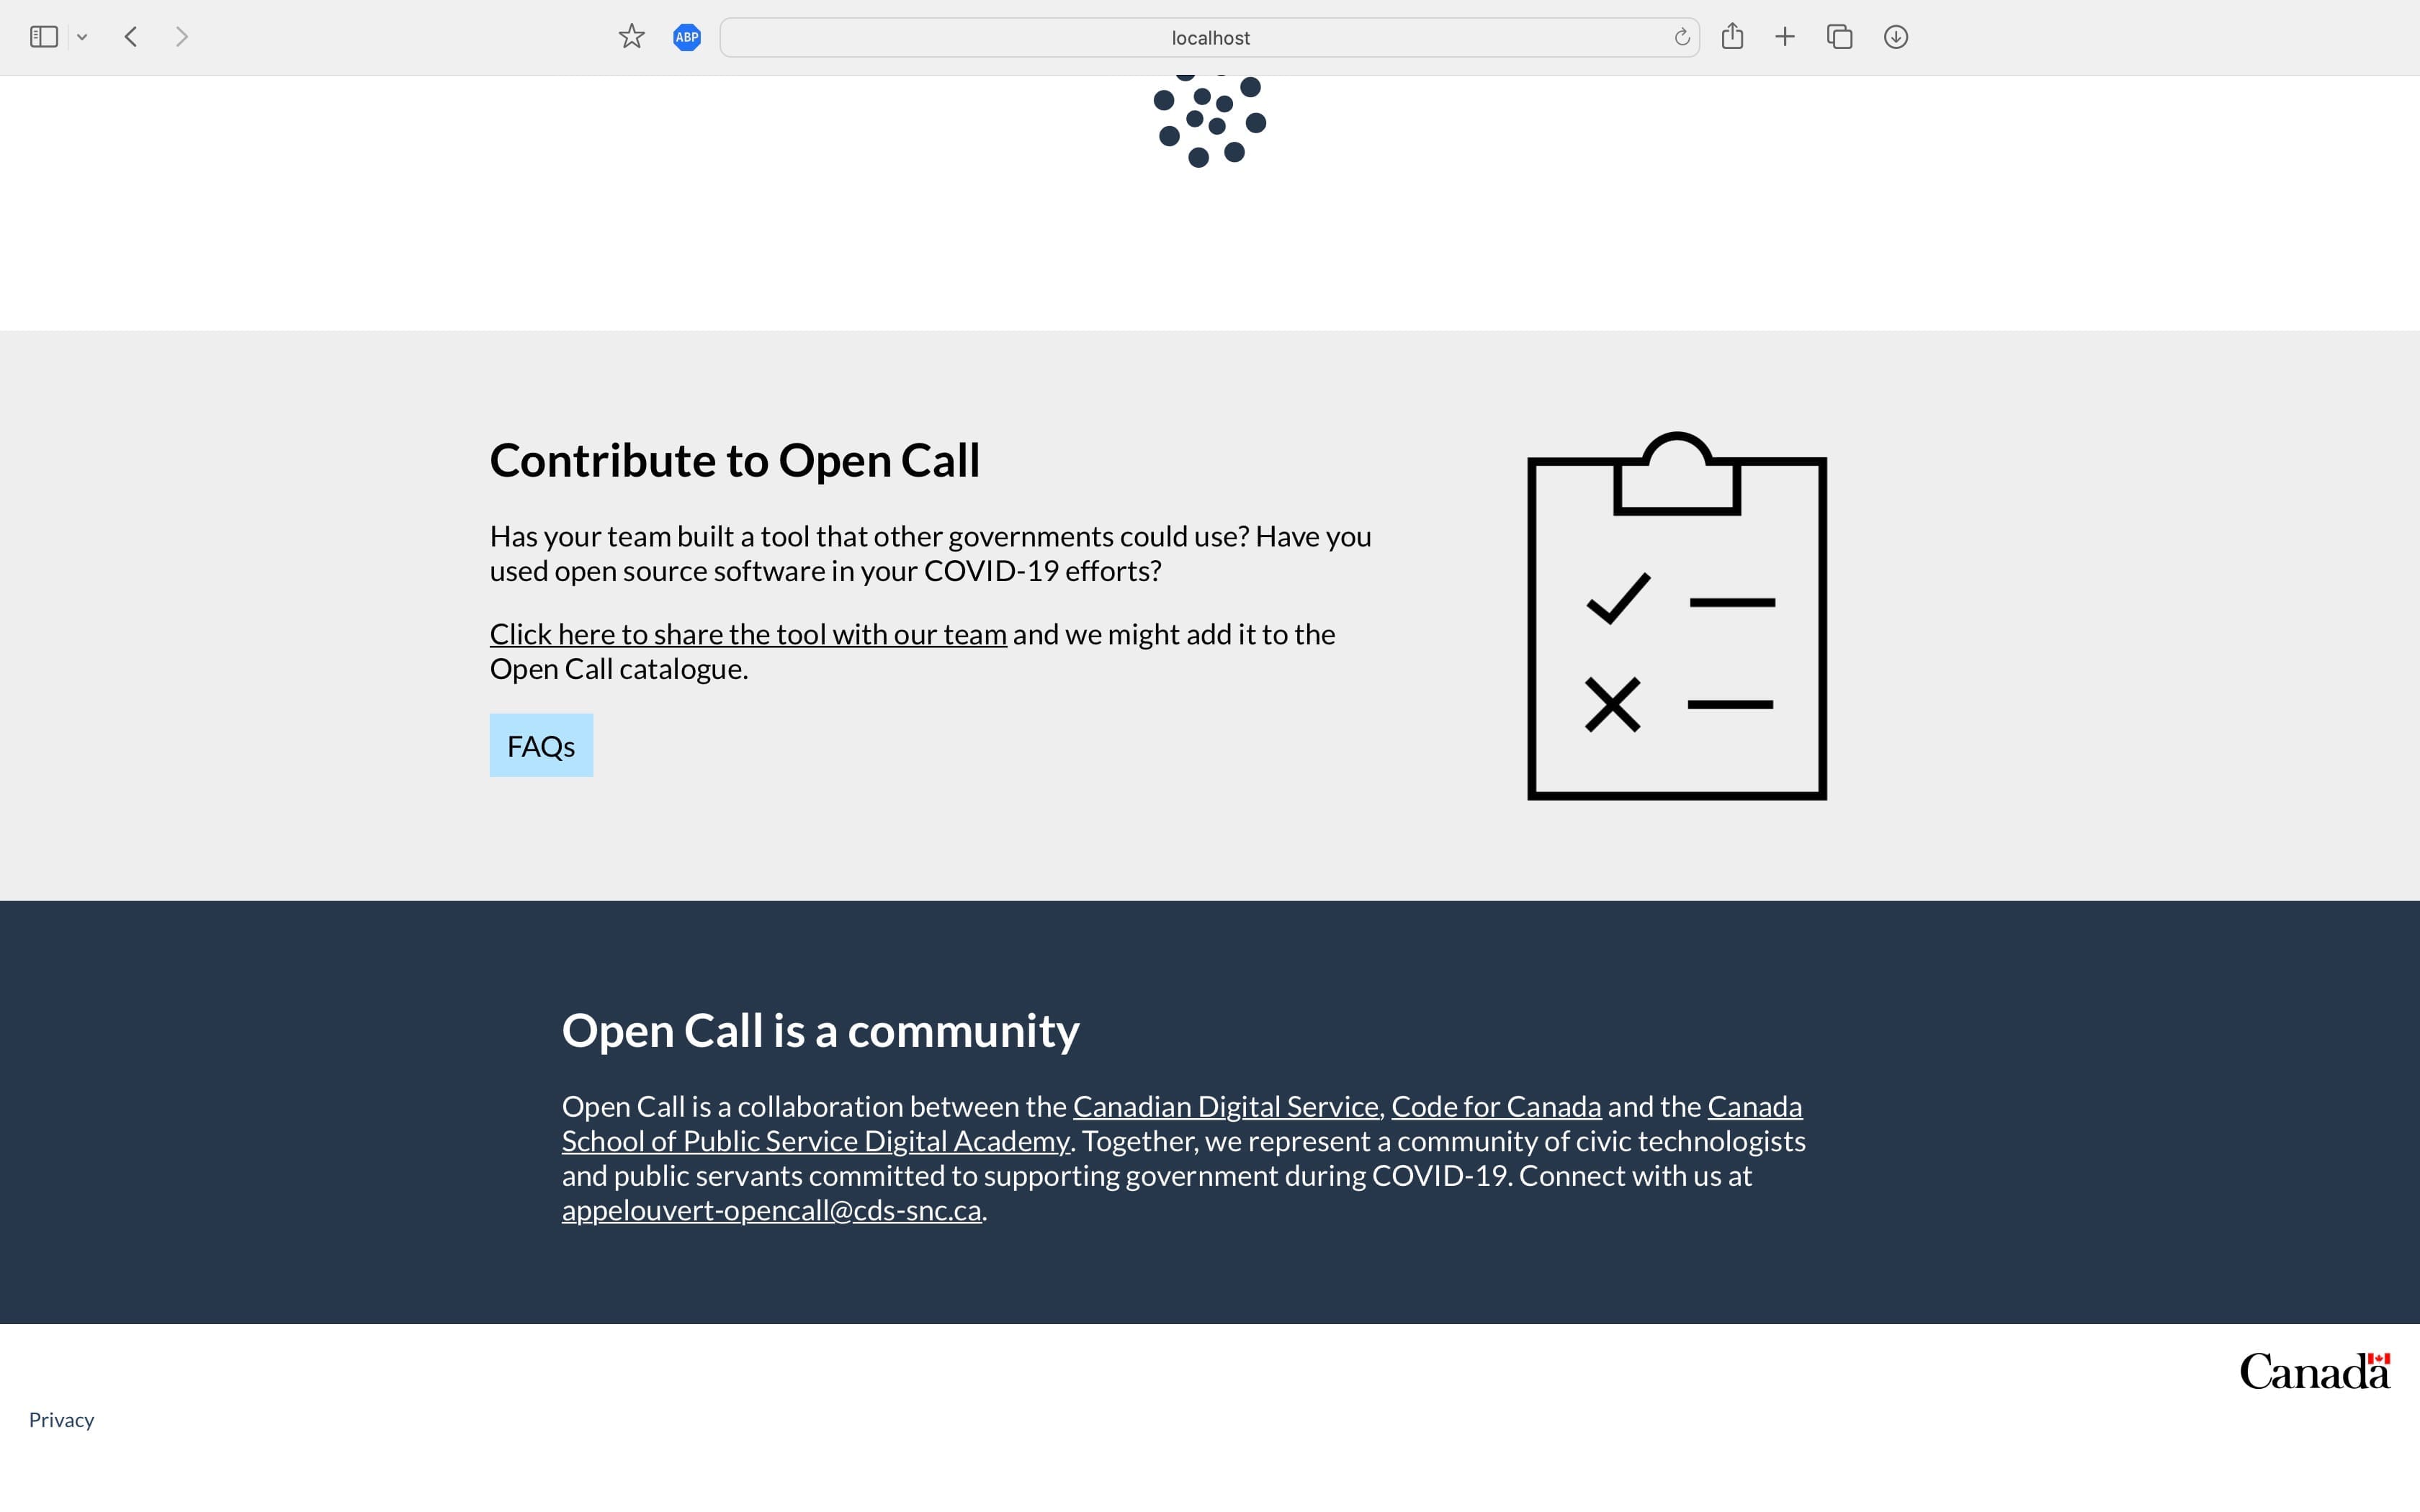
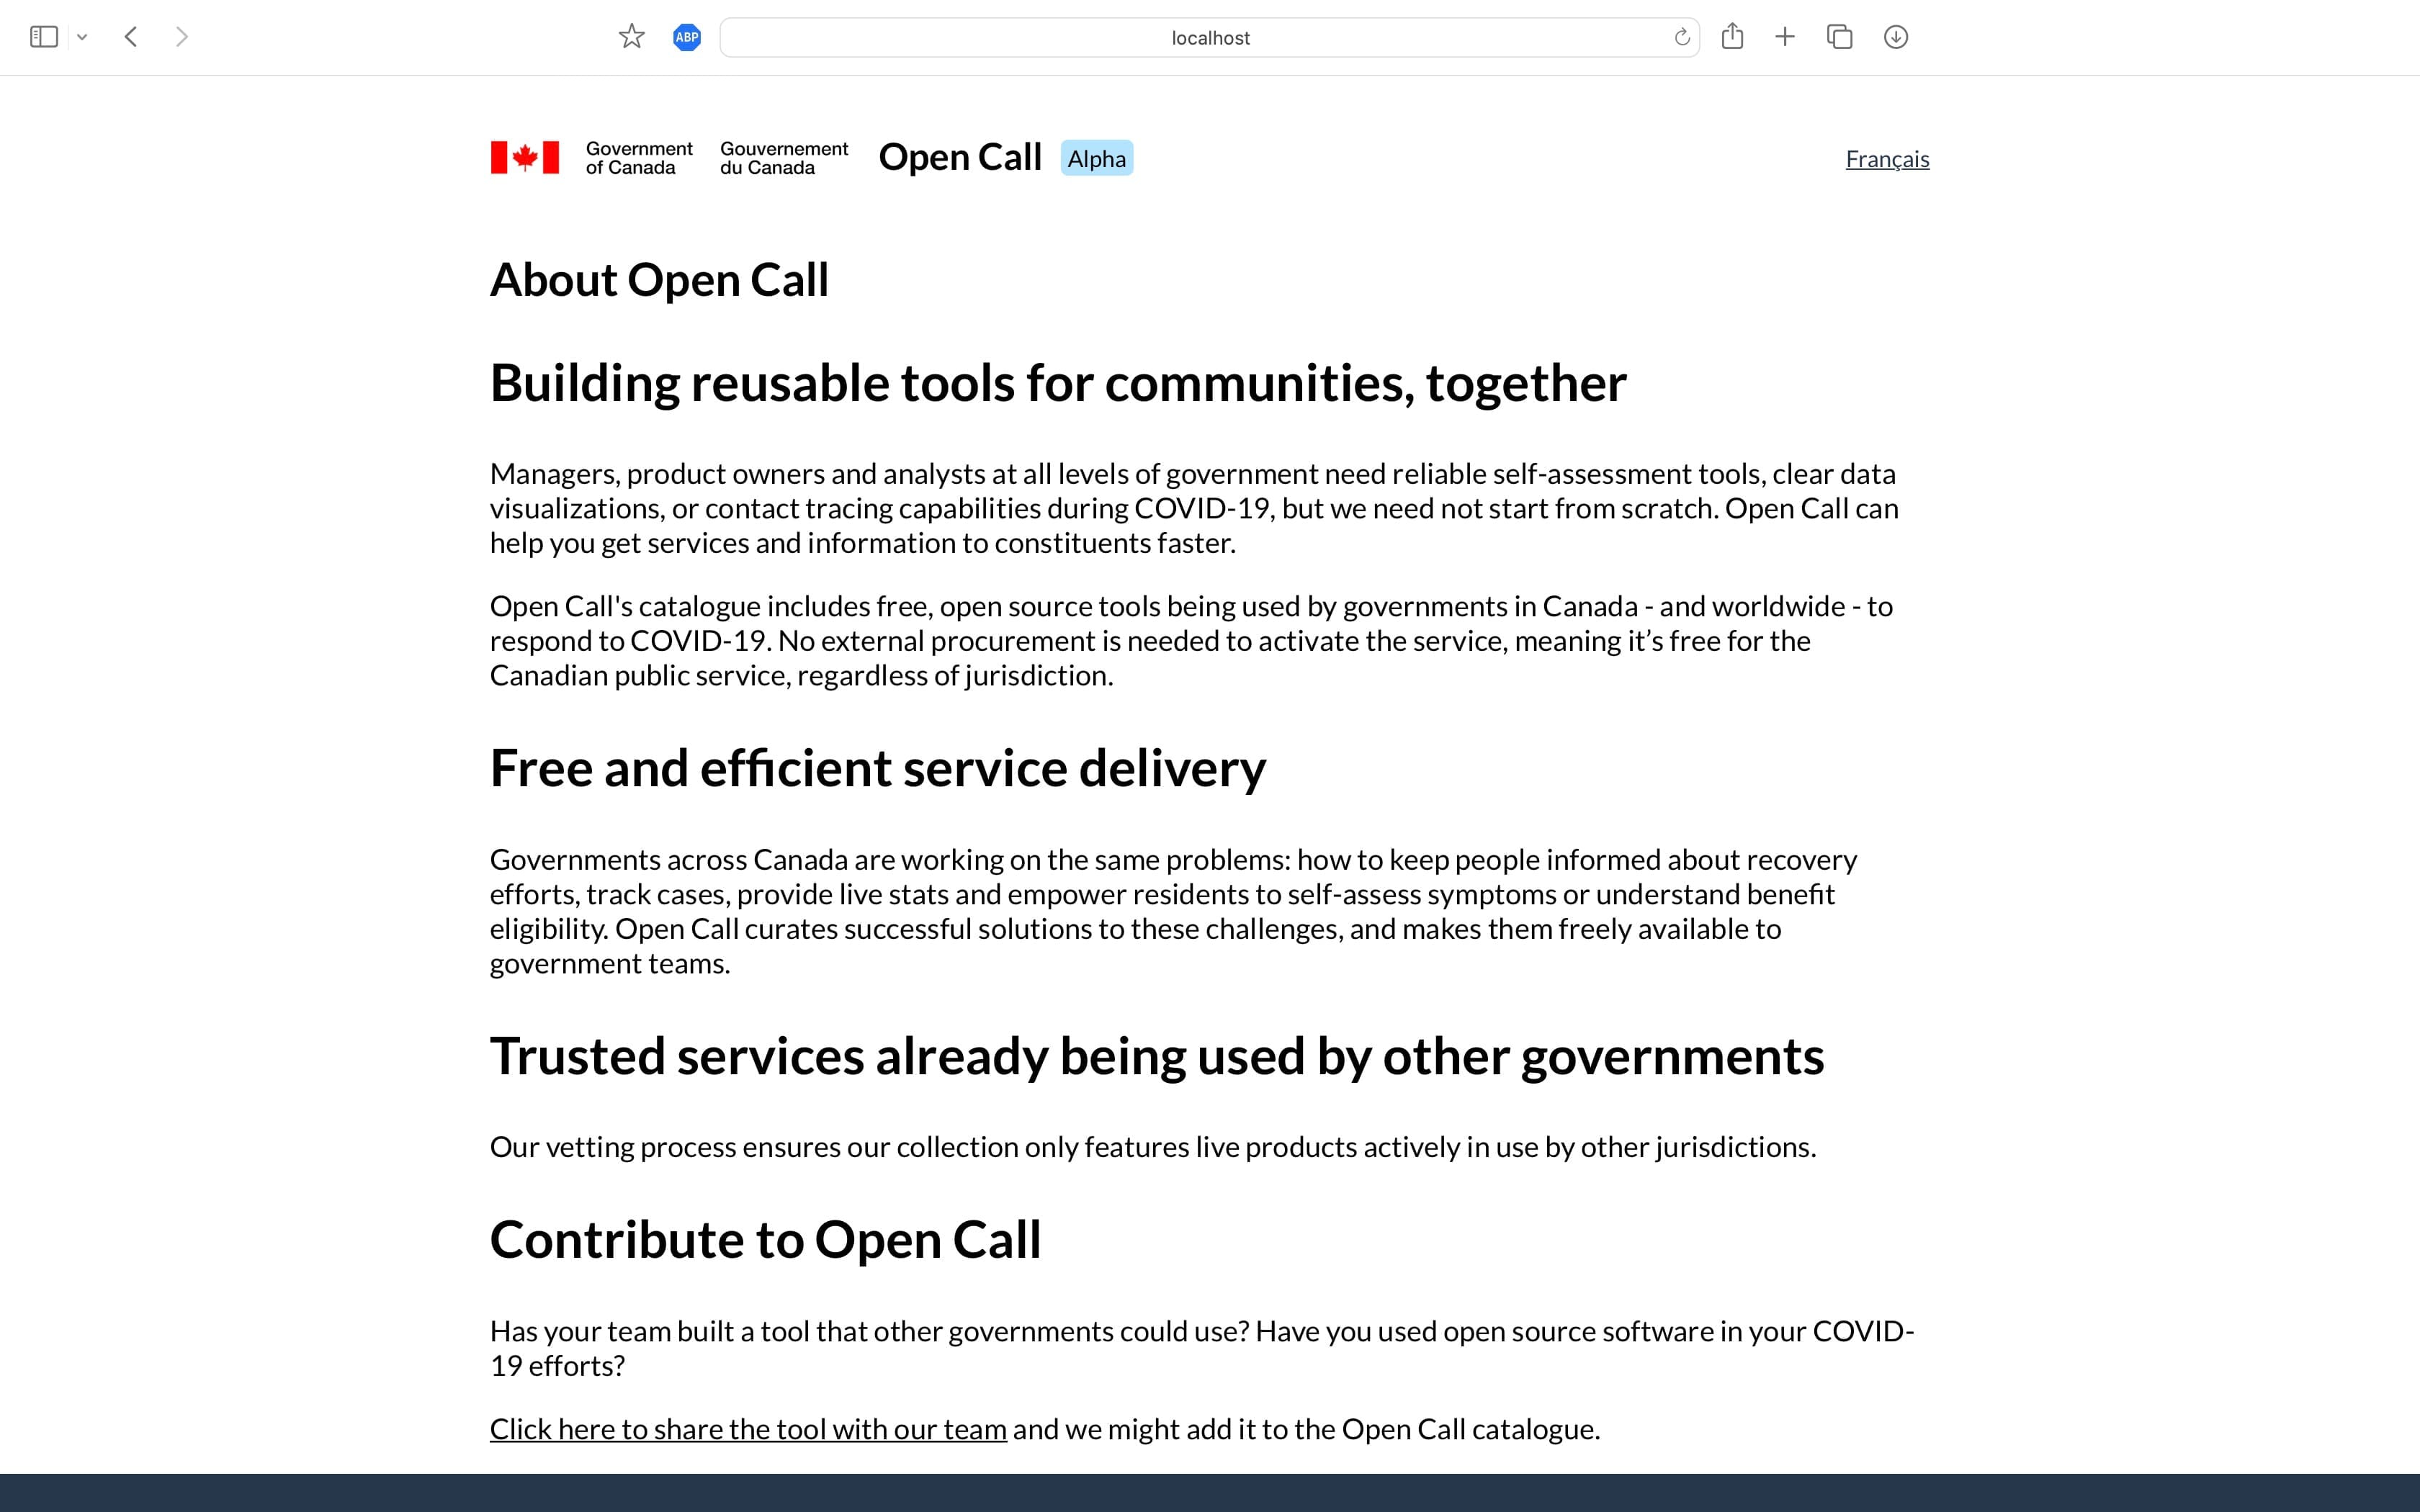
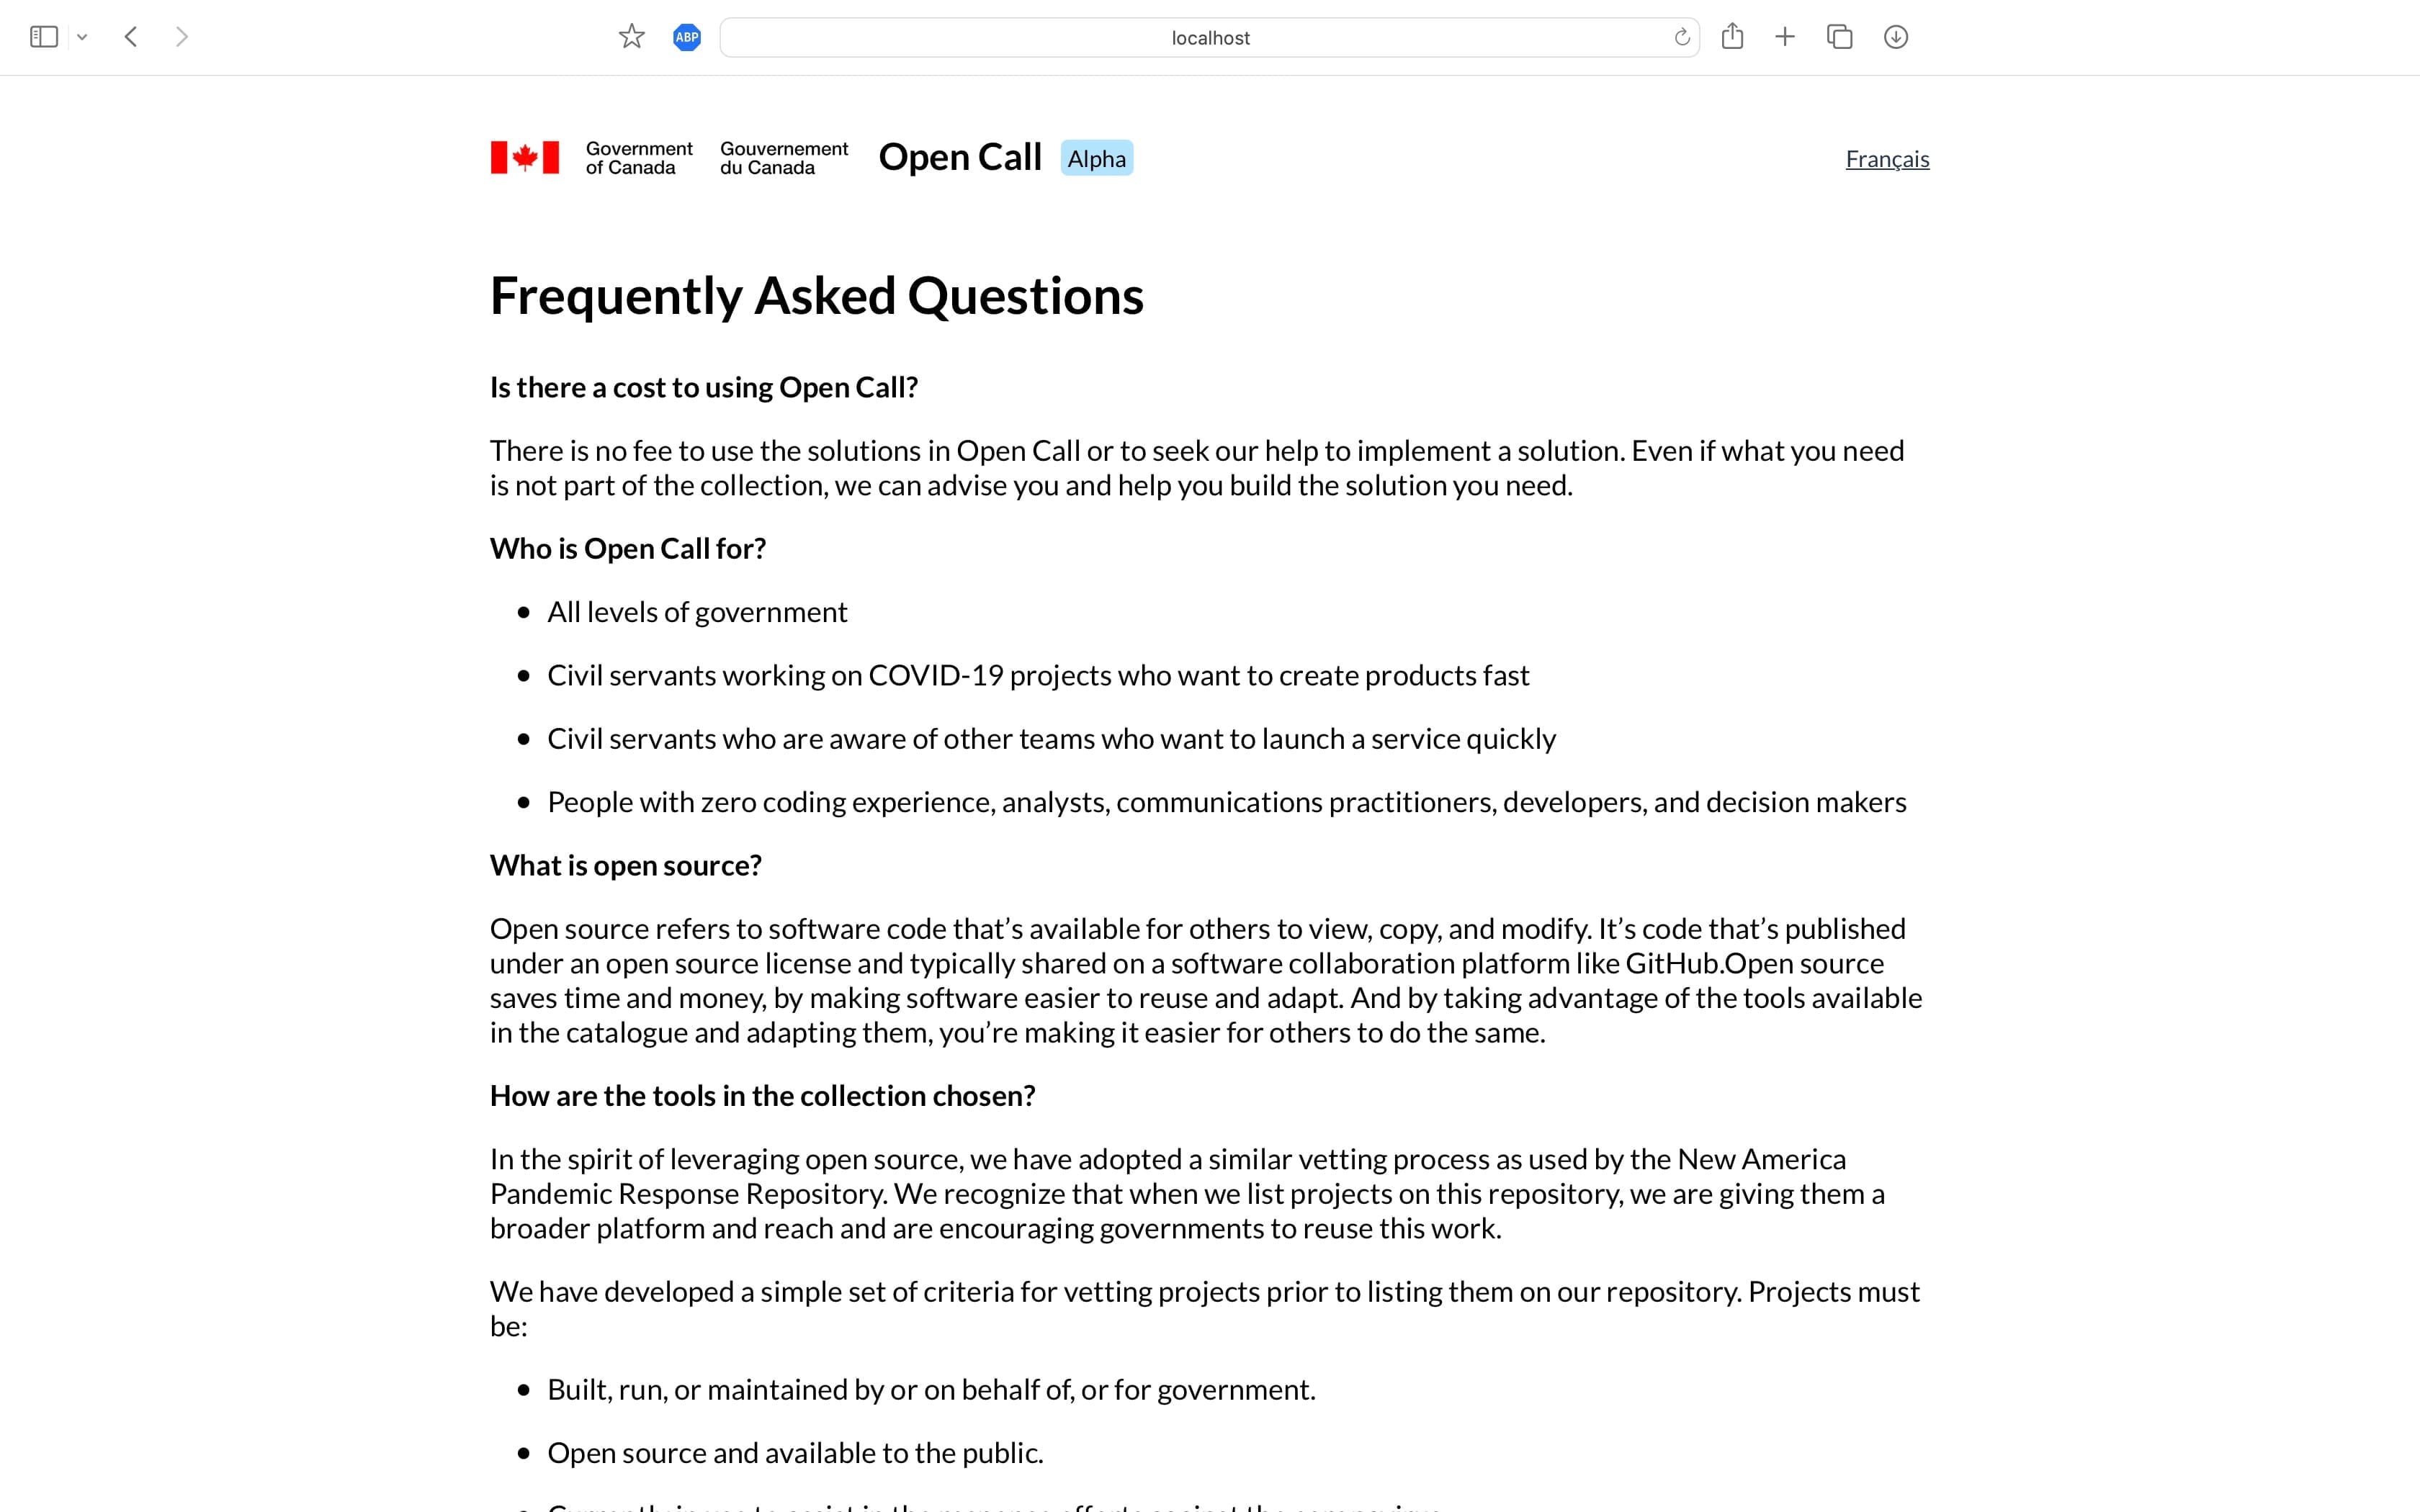
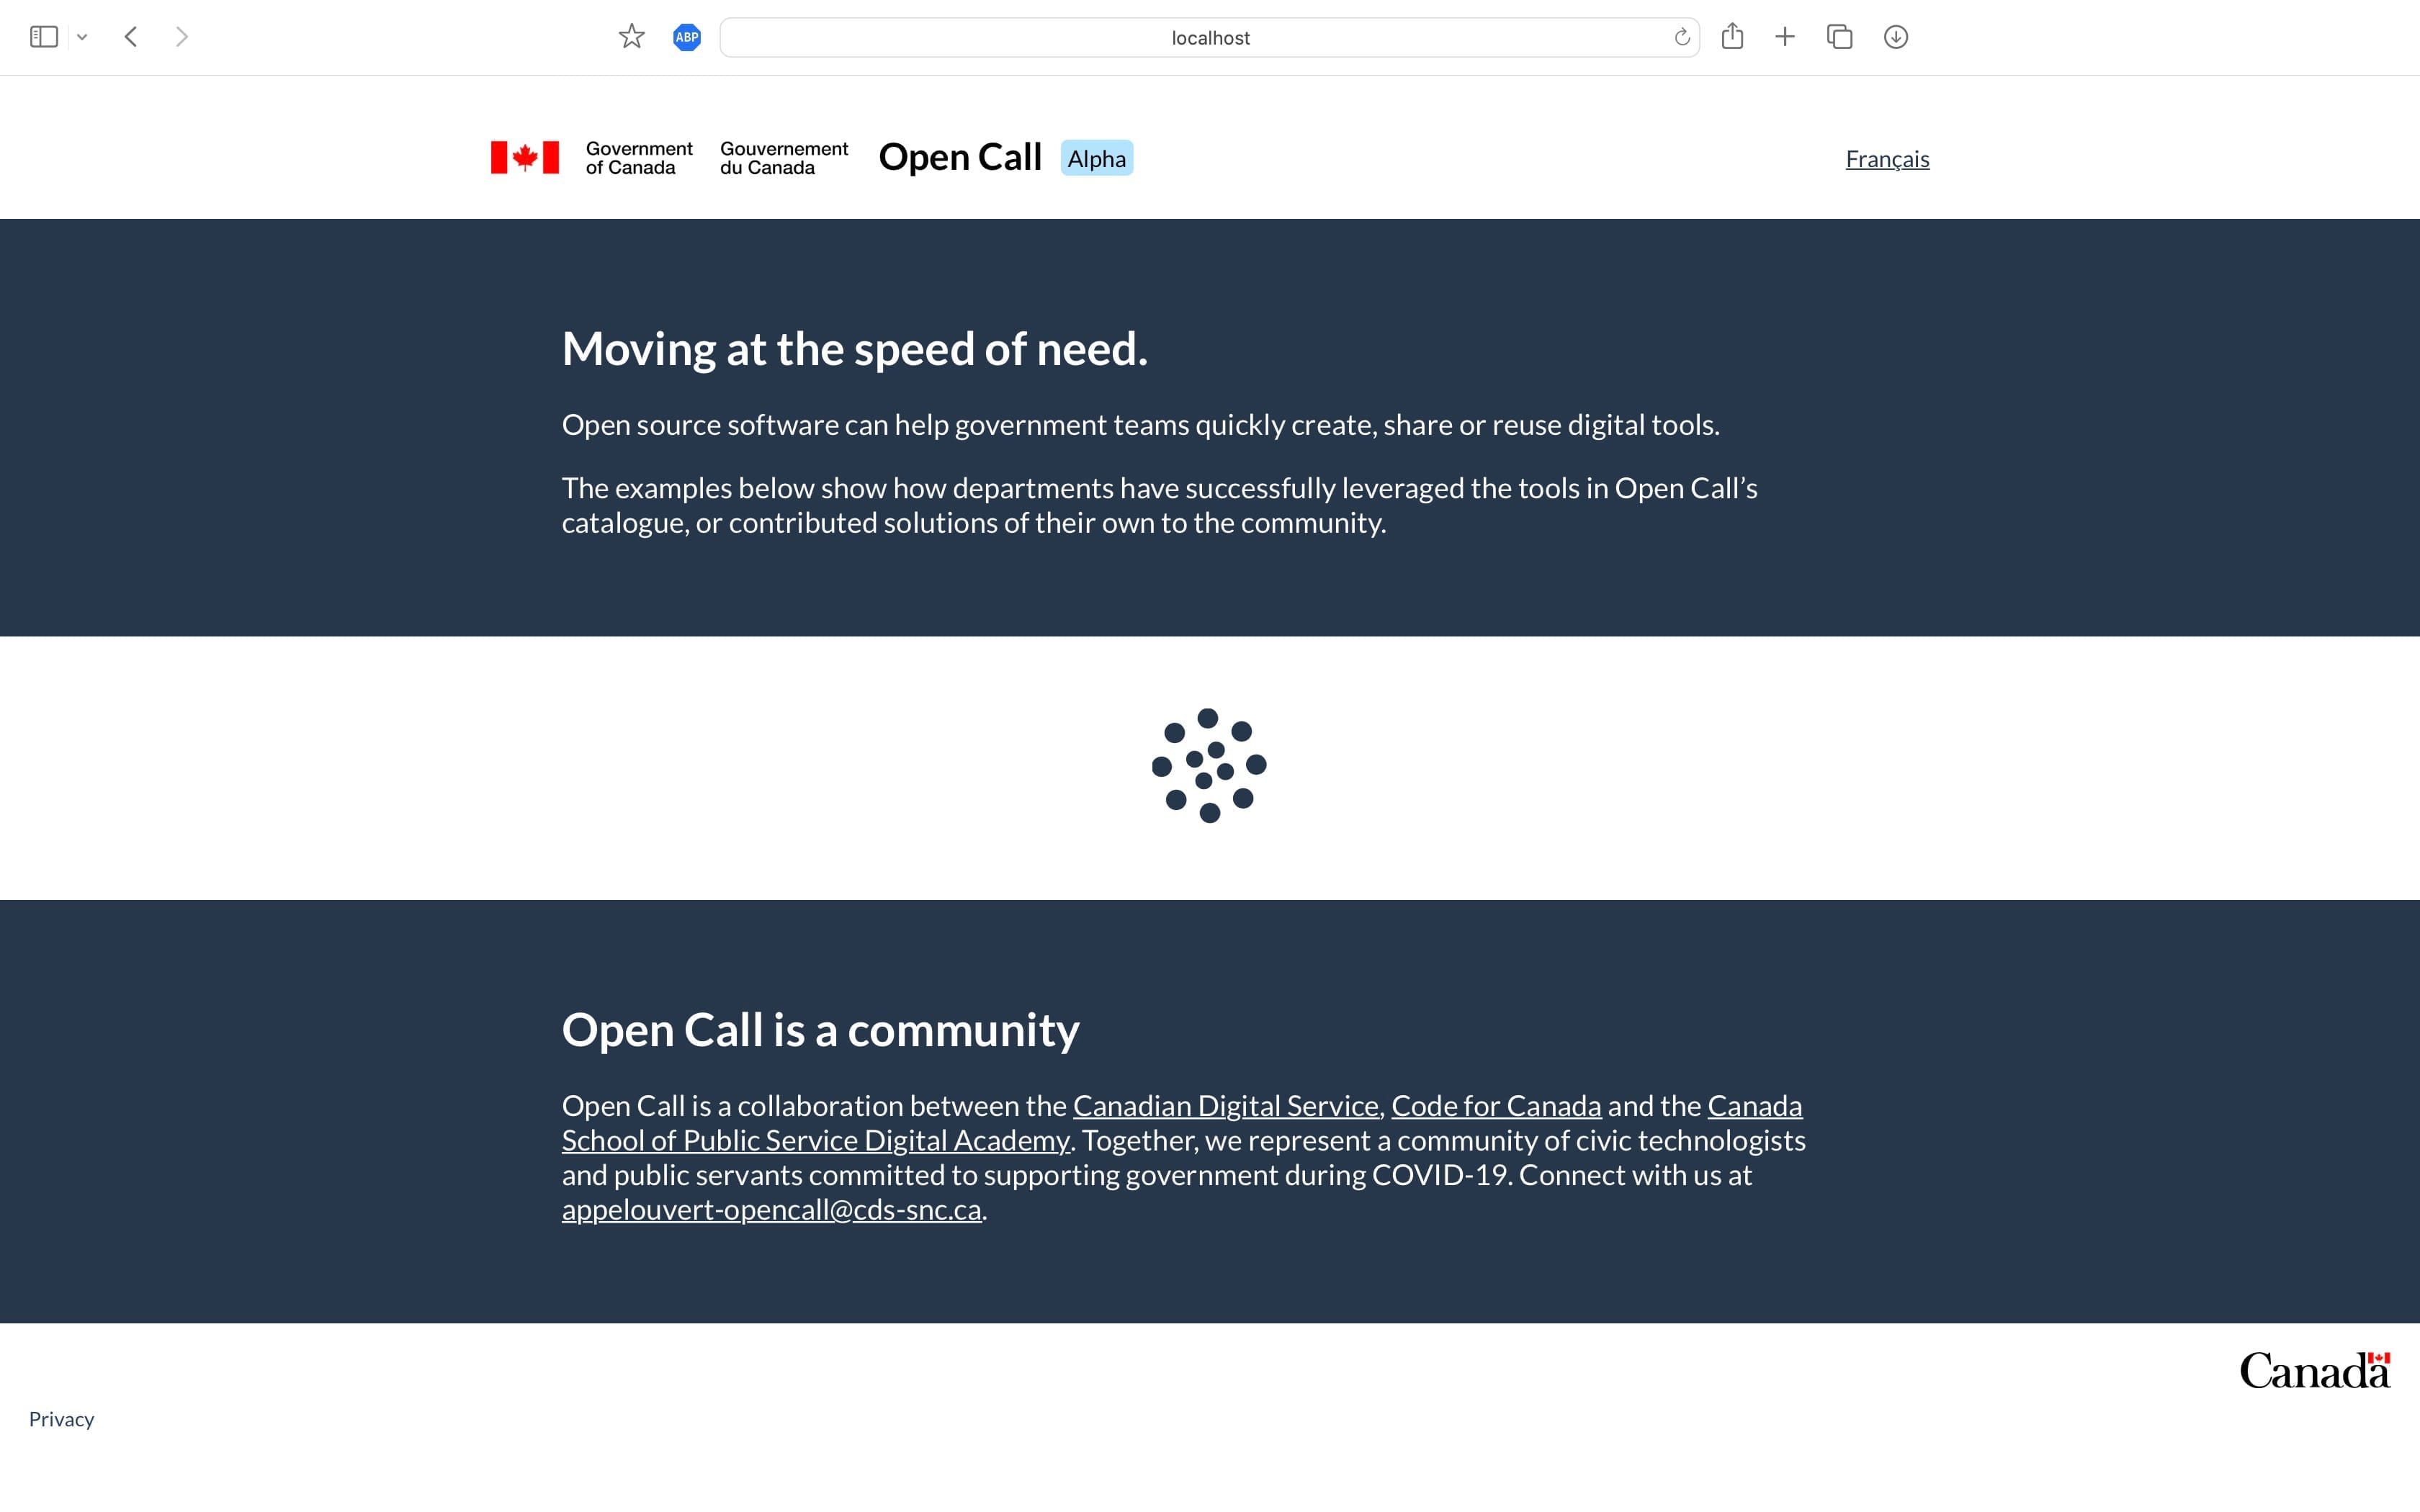
Open Call was a project initiated and quickly built during the heart of the COVID-19 pandemic, serving as a lifeline to smaller organizations and municipalities by providing them with essential COVID-19 related tools and resources. Collaborating with the Canadian Digital Service, Code for Canada and the Canada School of Public Service, I volunteered outside of my normal duties, taking on the role of lead developer for this crucial initiative. Open Call functioned as a comprehensive catalog of valuable COVID-related resources, tools and APIs powered by a simple yet powerful backend built on the Google sheets API - easily enabling non-technical staff to add new resources. My dedication and impact was so significant that it led to being scouted by the Chief Medical Officer of Canada, Dr. Theresa Tam to contribute to the development of a data management tool for handling the influx of COVID-19 data her team was receiving. The tool has since been decommissioned and with the API being taken down, the loading indicator now spins where the catalogue items were.
- React
- JavaScript
- HTML
- CSS

Data Literacy Assessment
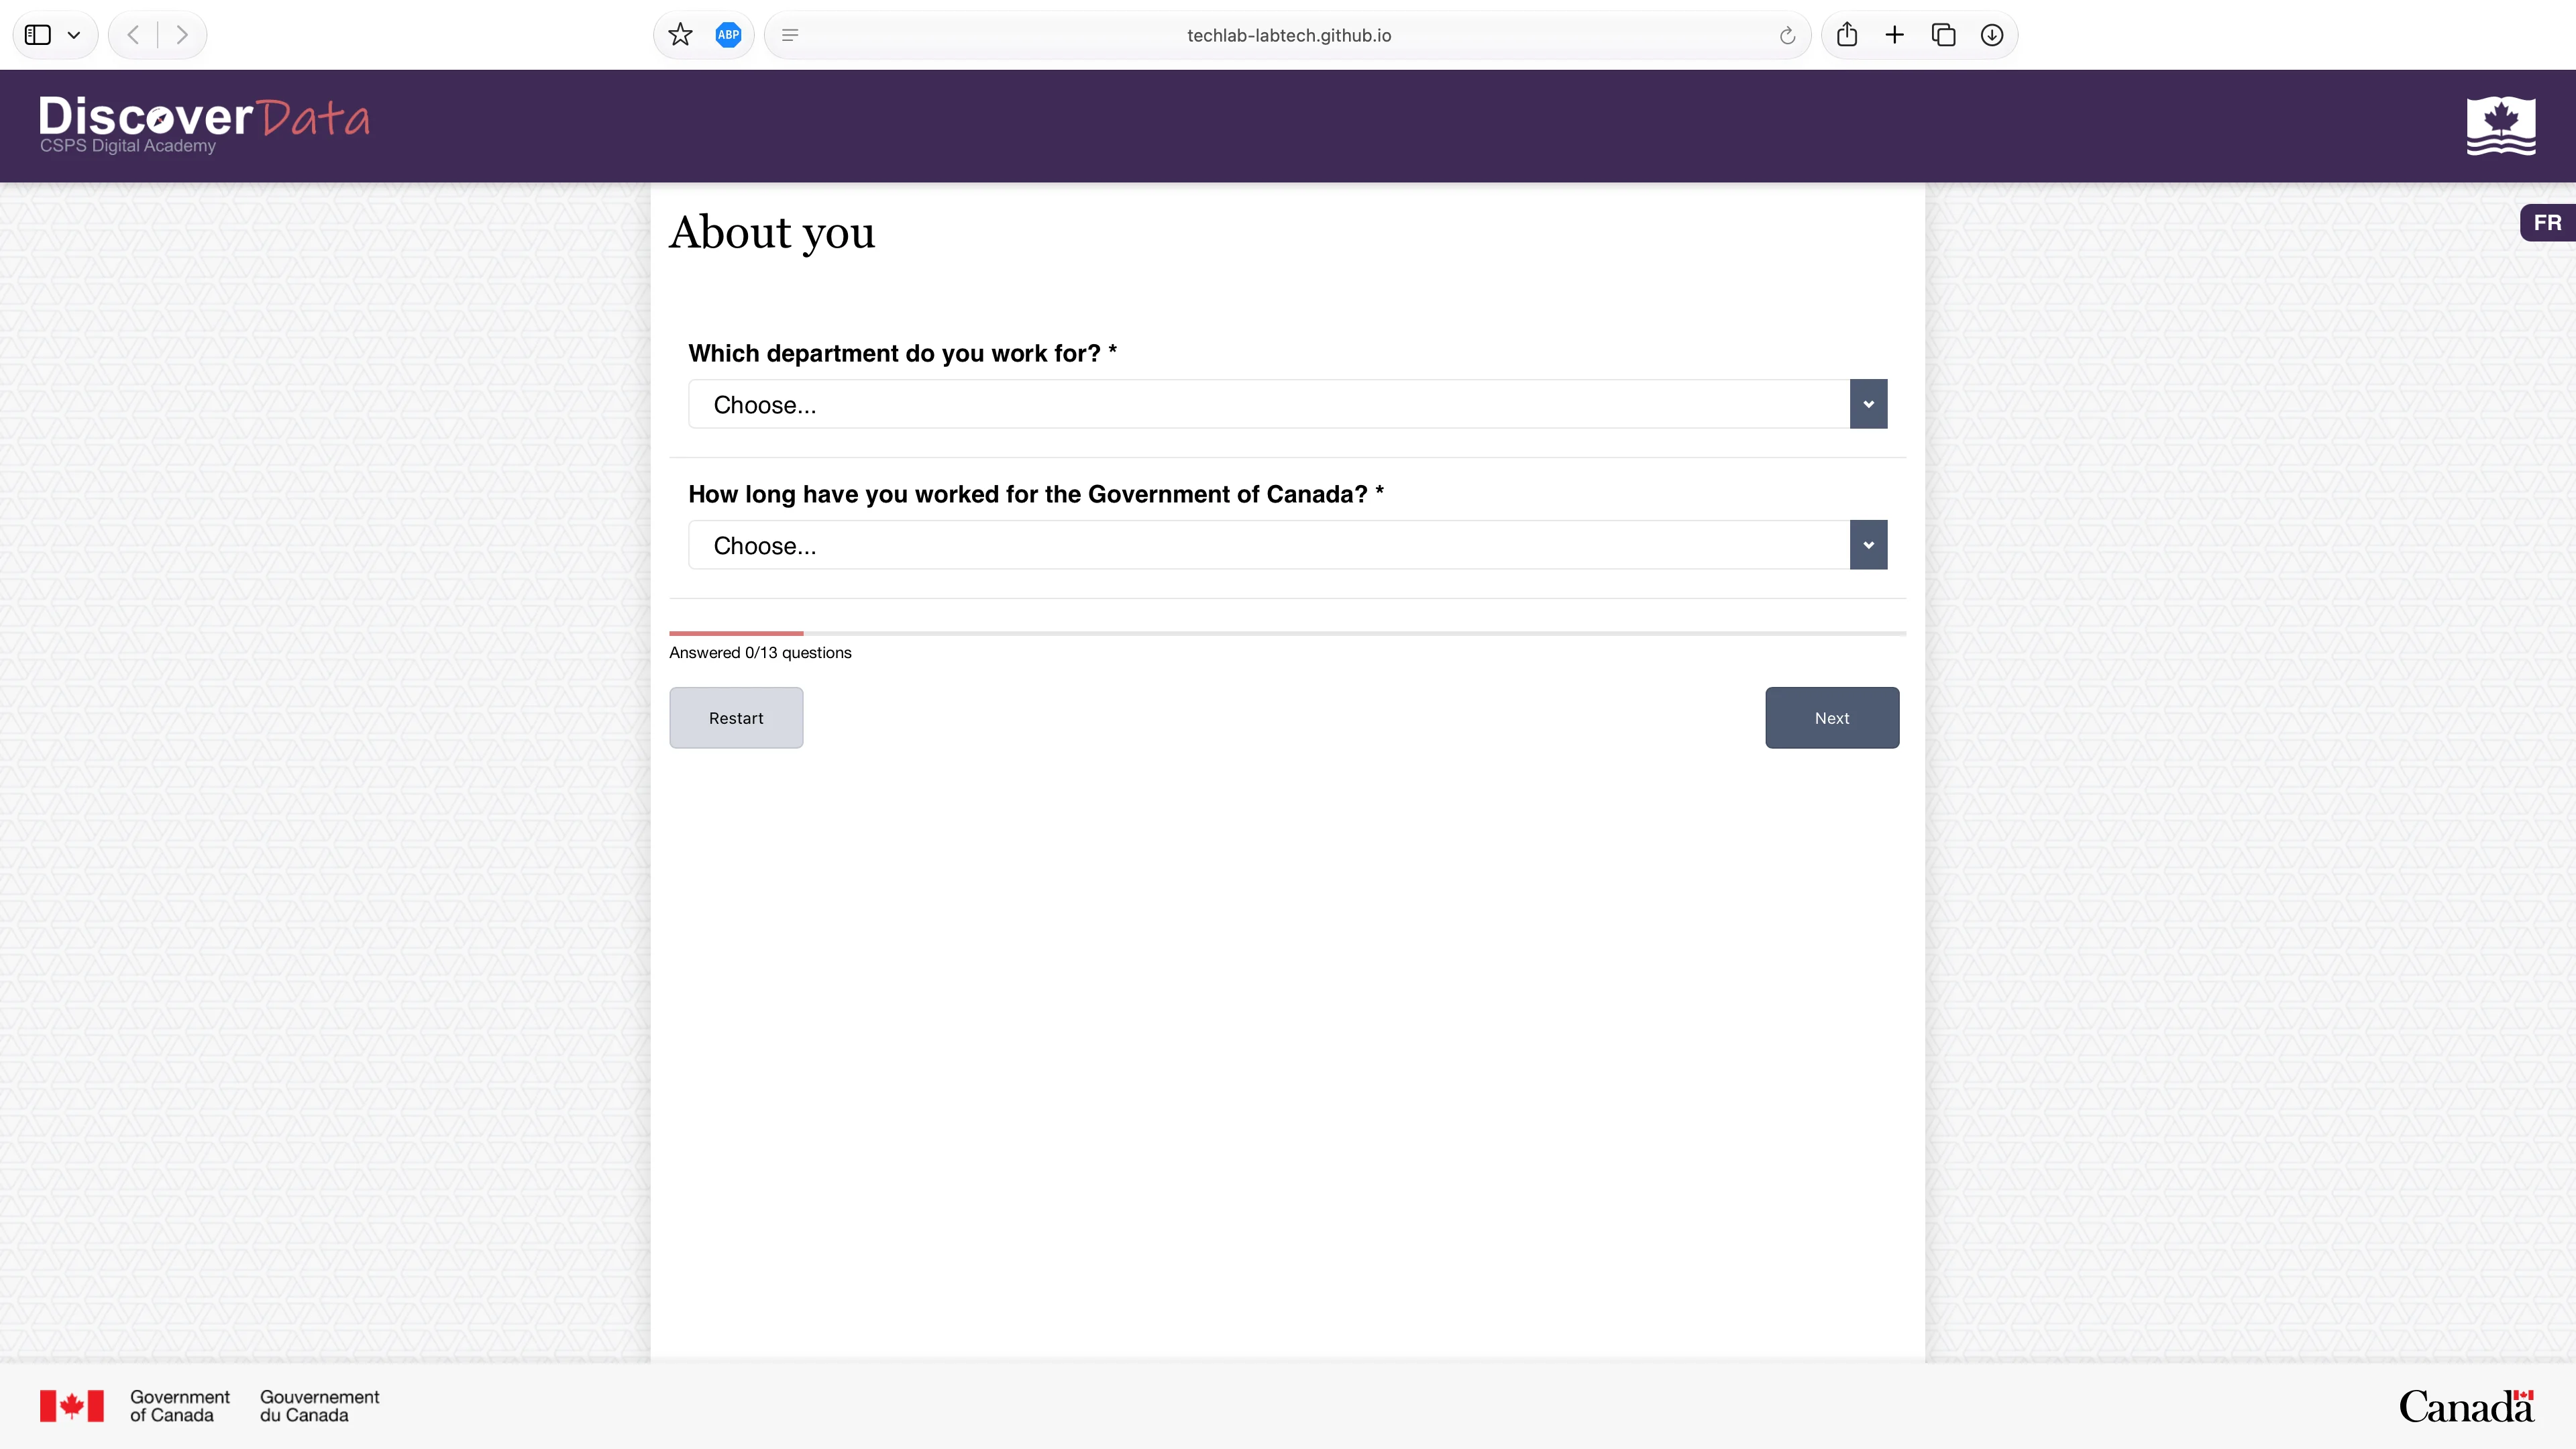
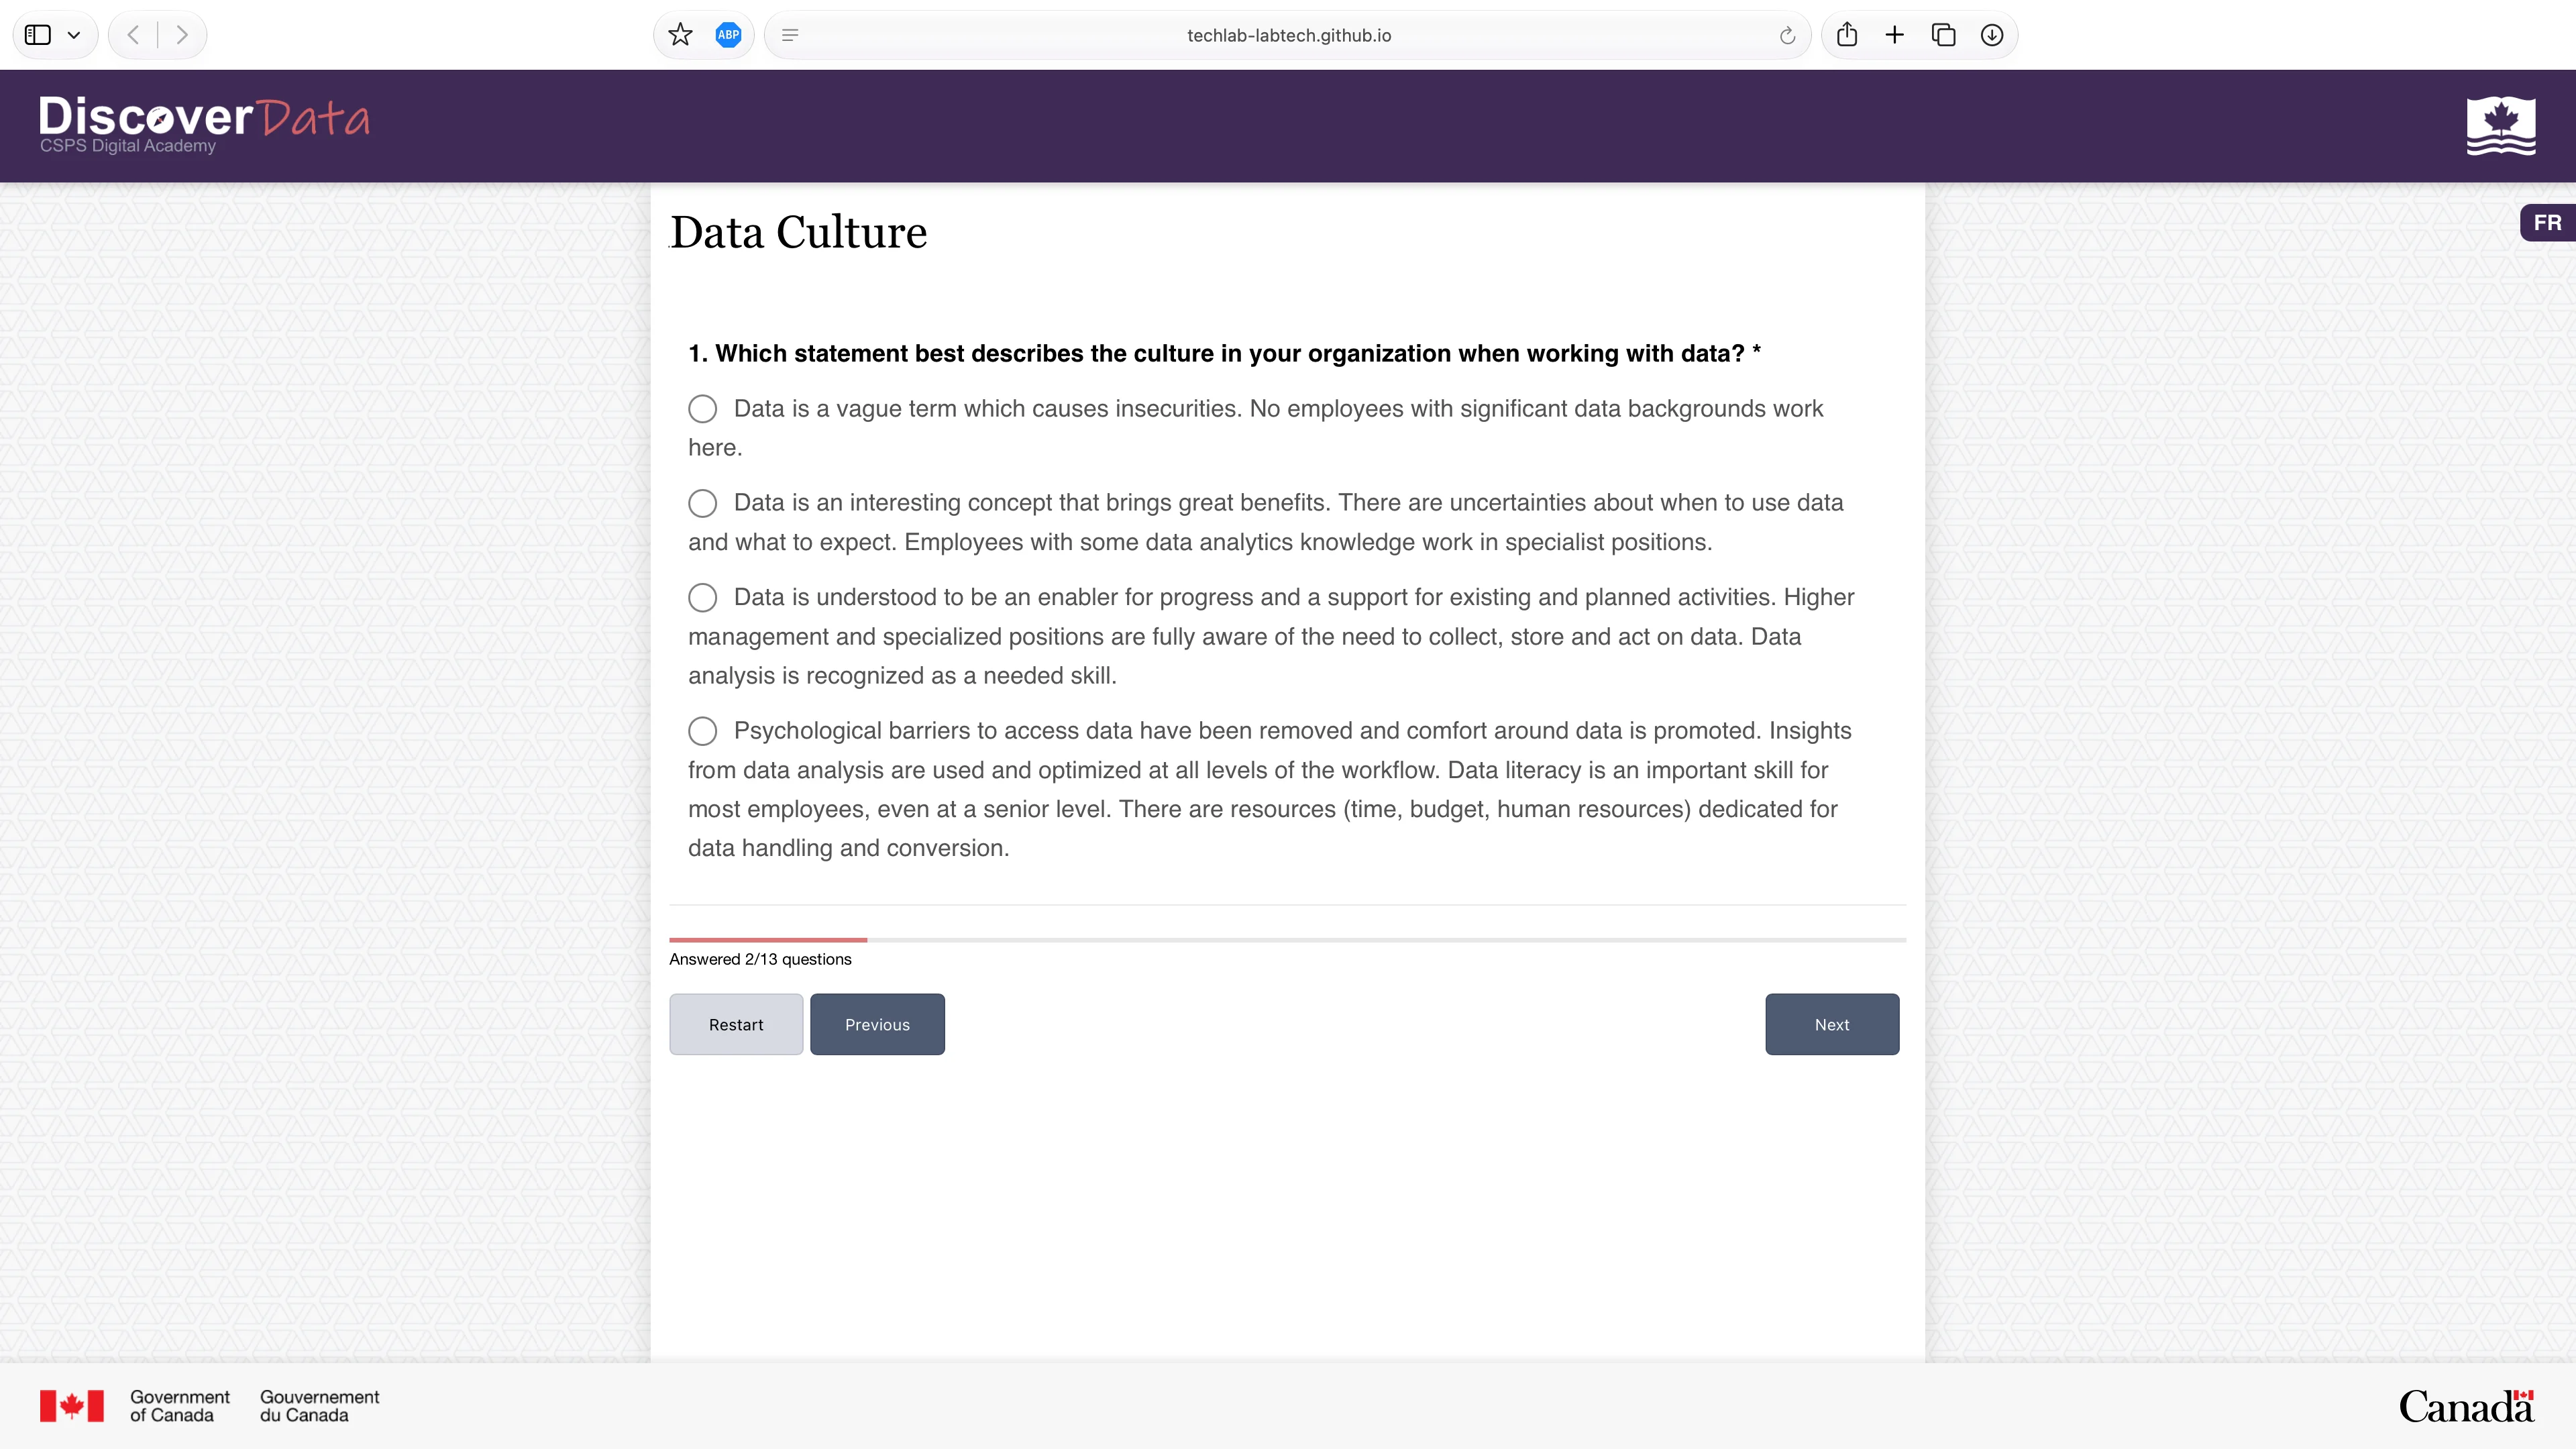
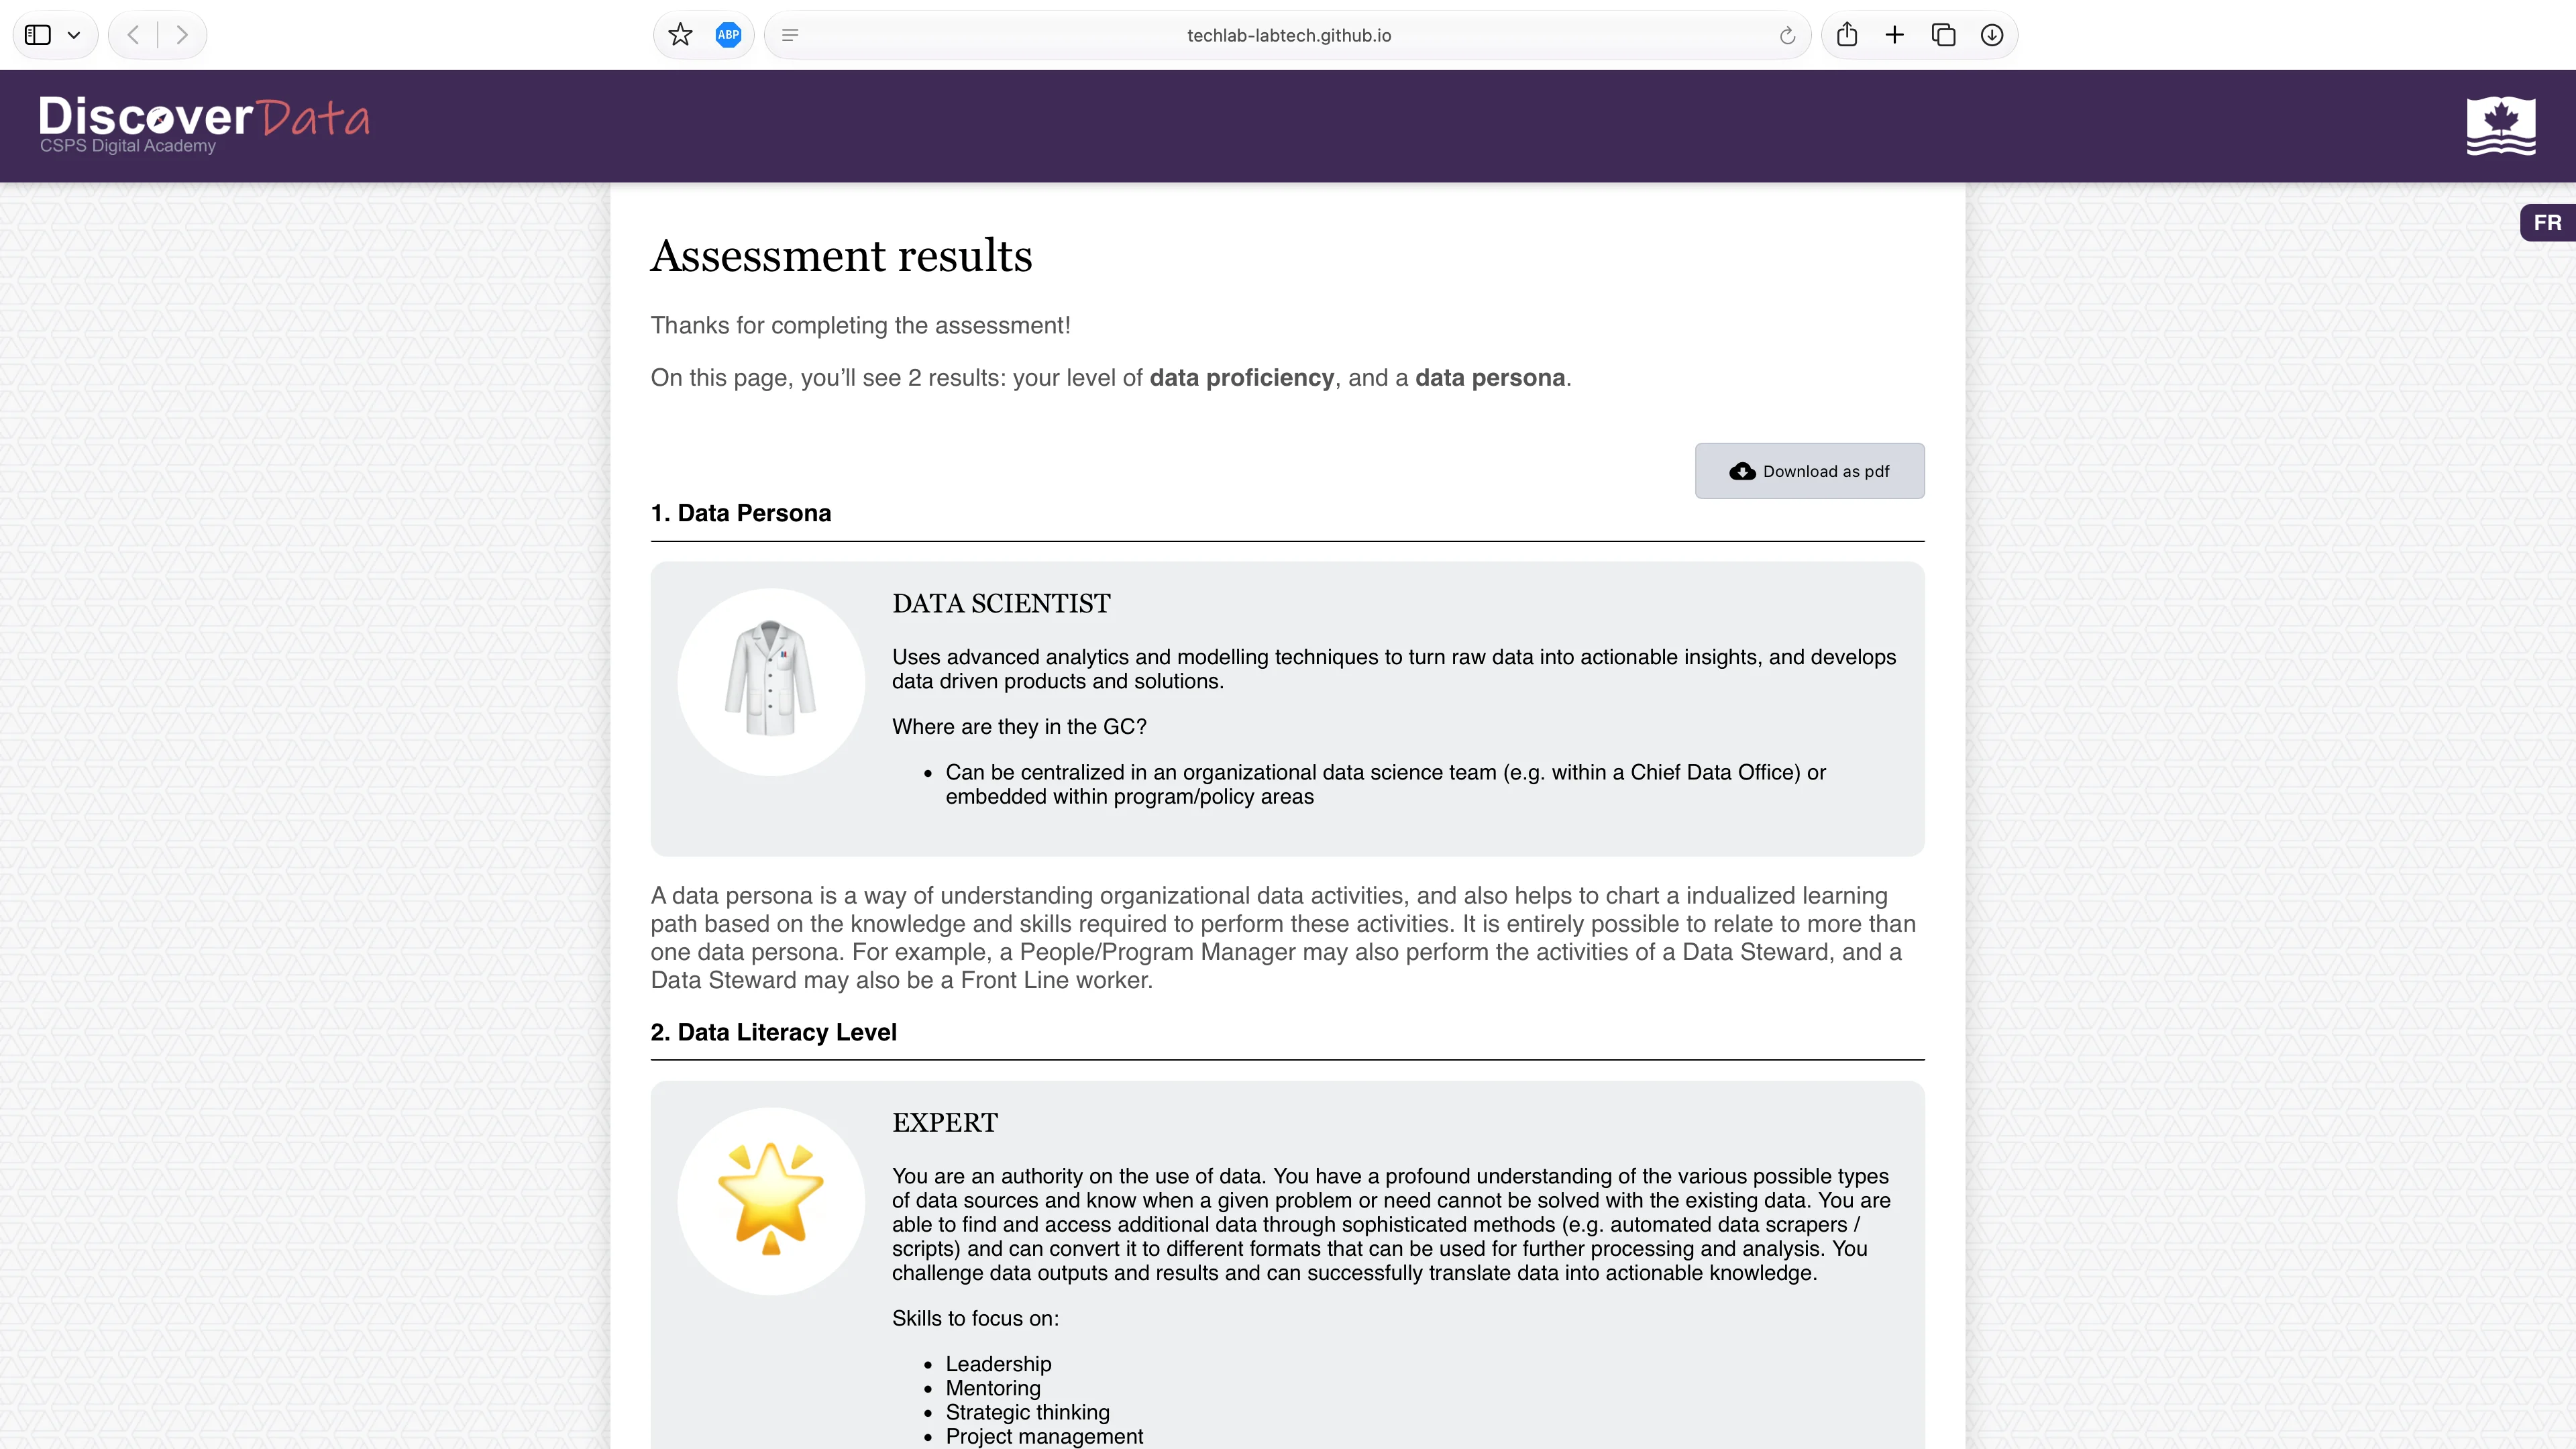
The Data Literacy Assessment is an interactive self-assessment developed to help Government of Canada employees evaluate their data competencies and identify opportunities for professional development. As the project's lead developer, I transformed the assessment concept into a complete React application while adhering to our established design standards. The application guides users through a structured assessment and generates personalized results and learning recommendations based on their responses. Firebase was integrated to collect anonymized aggregate data for organizational planning and reporting, with additional custom functionality allowing users to export their results as a PDF.
- React
- JavaScript
- HTML
- CSS
- Node.js
 MongoDB
 Google Firebase

vExpo
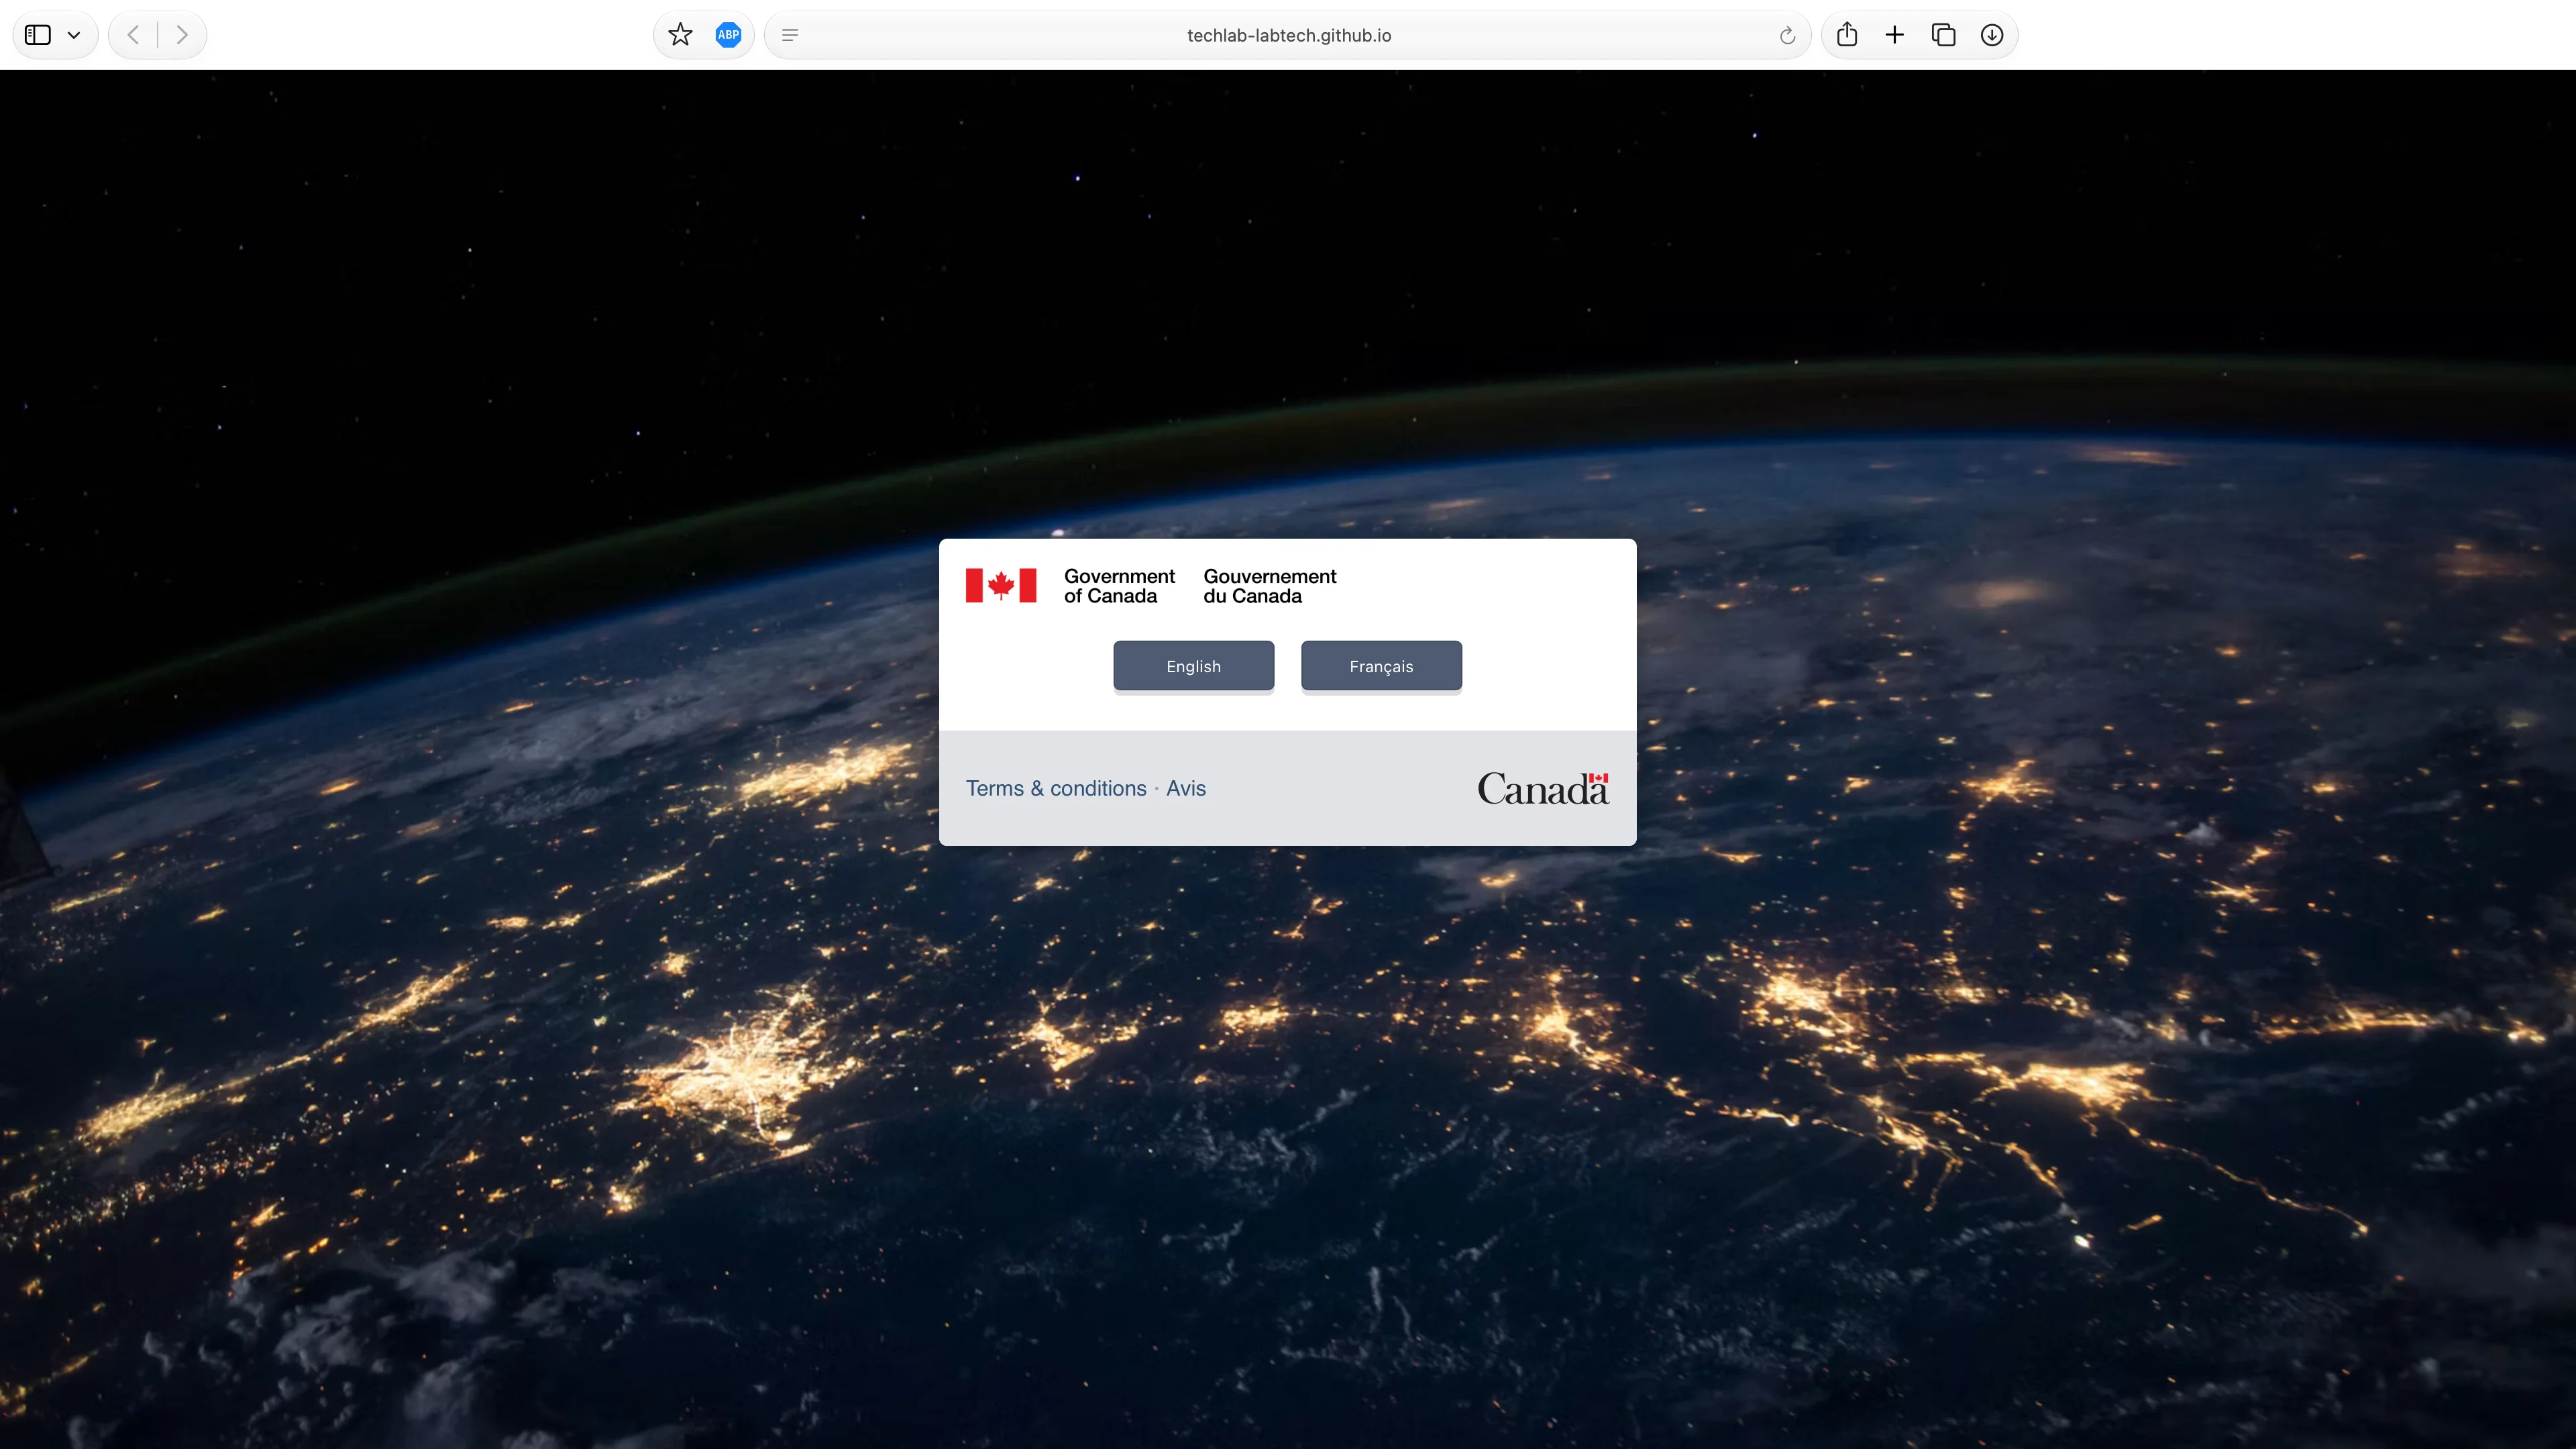
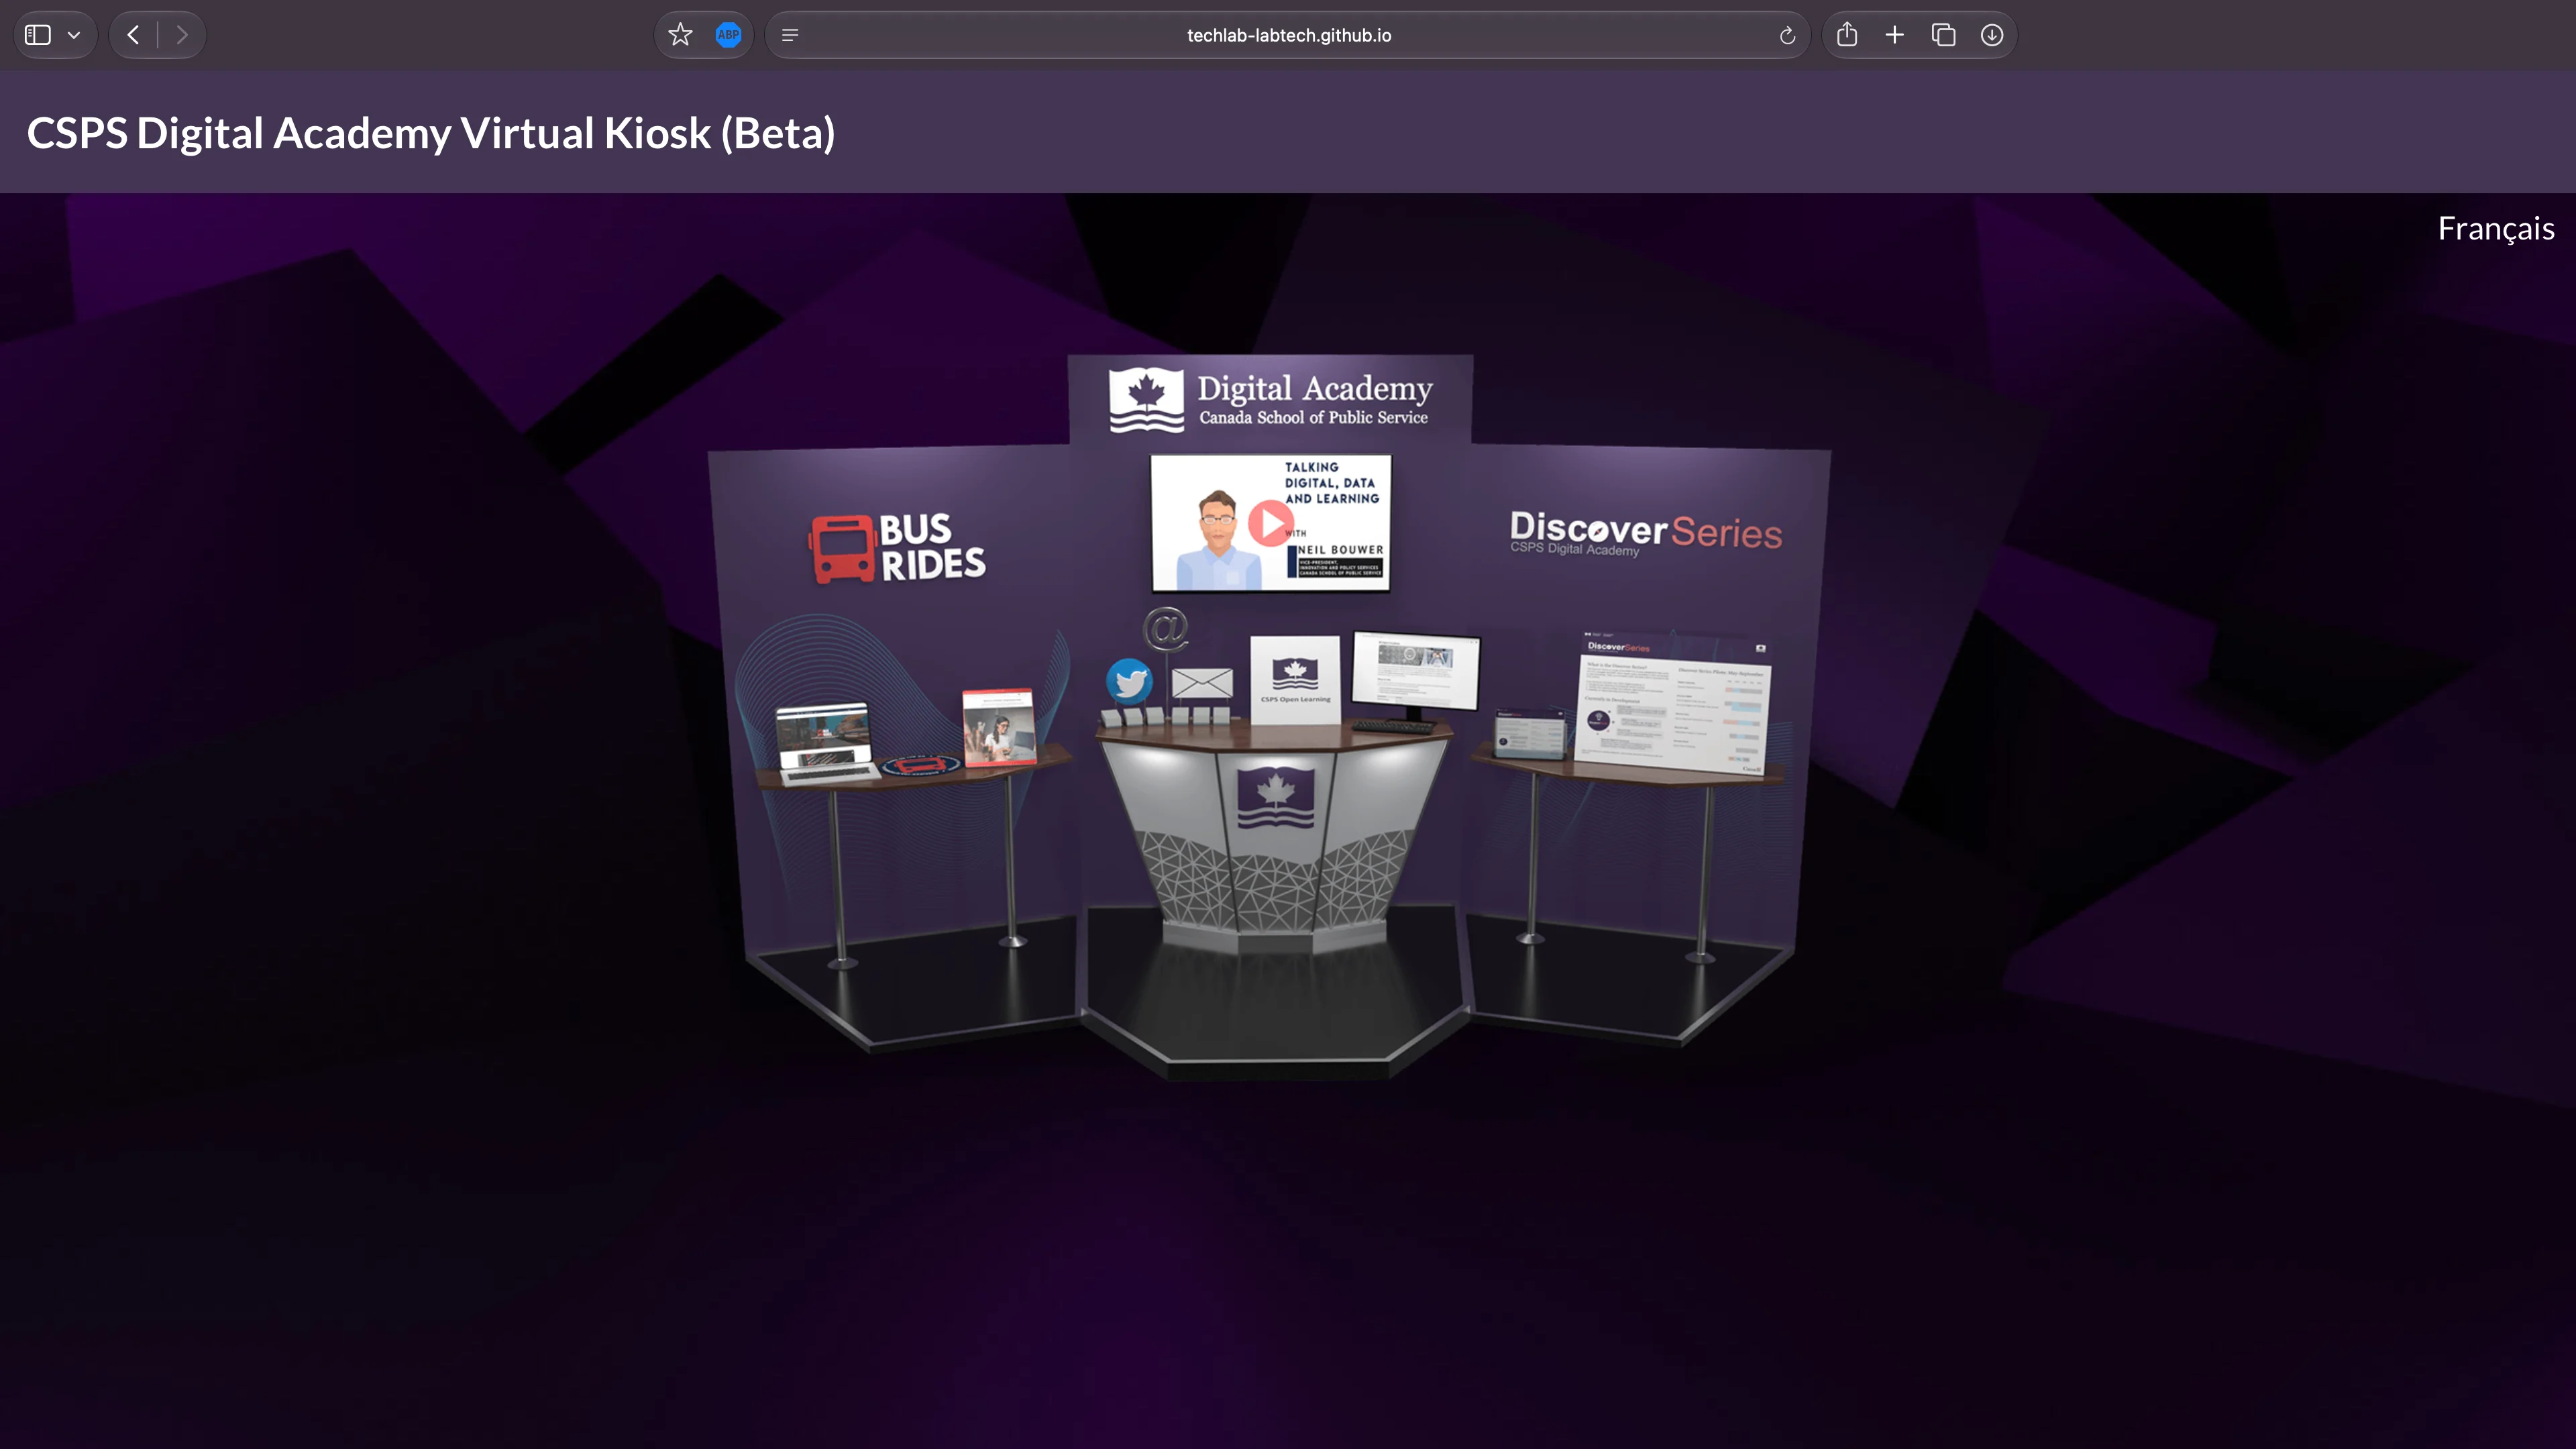
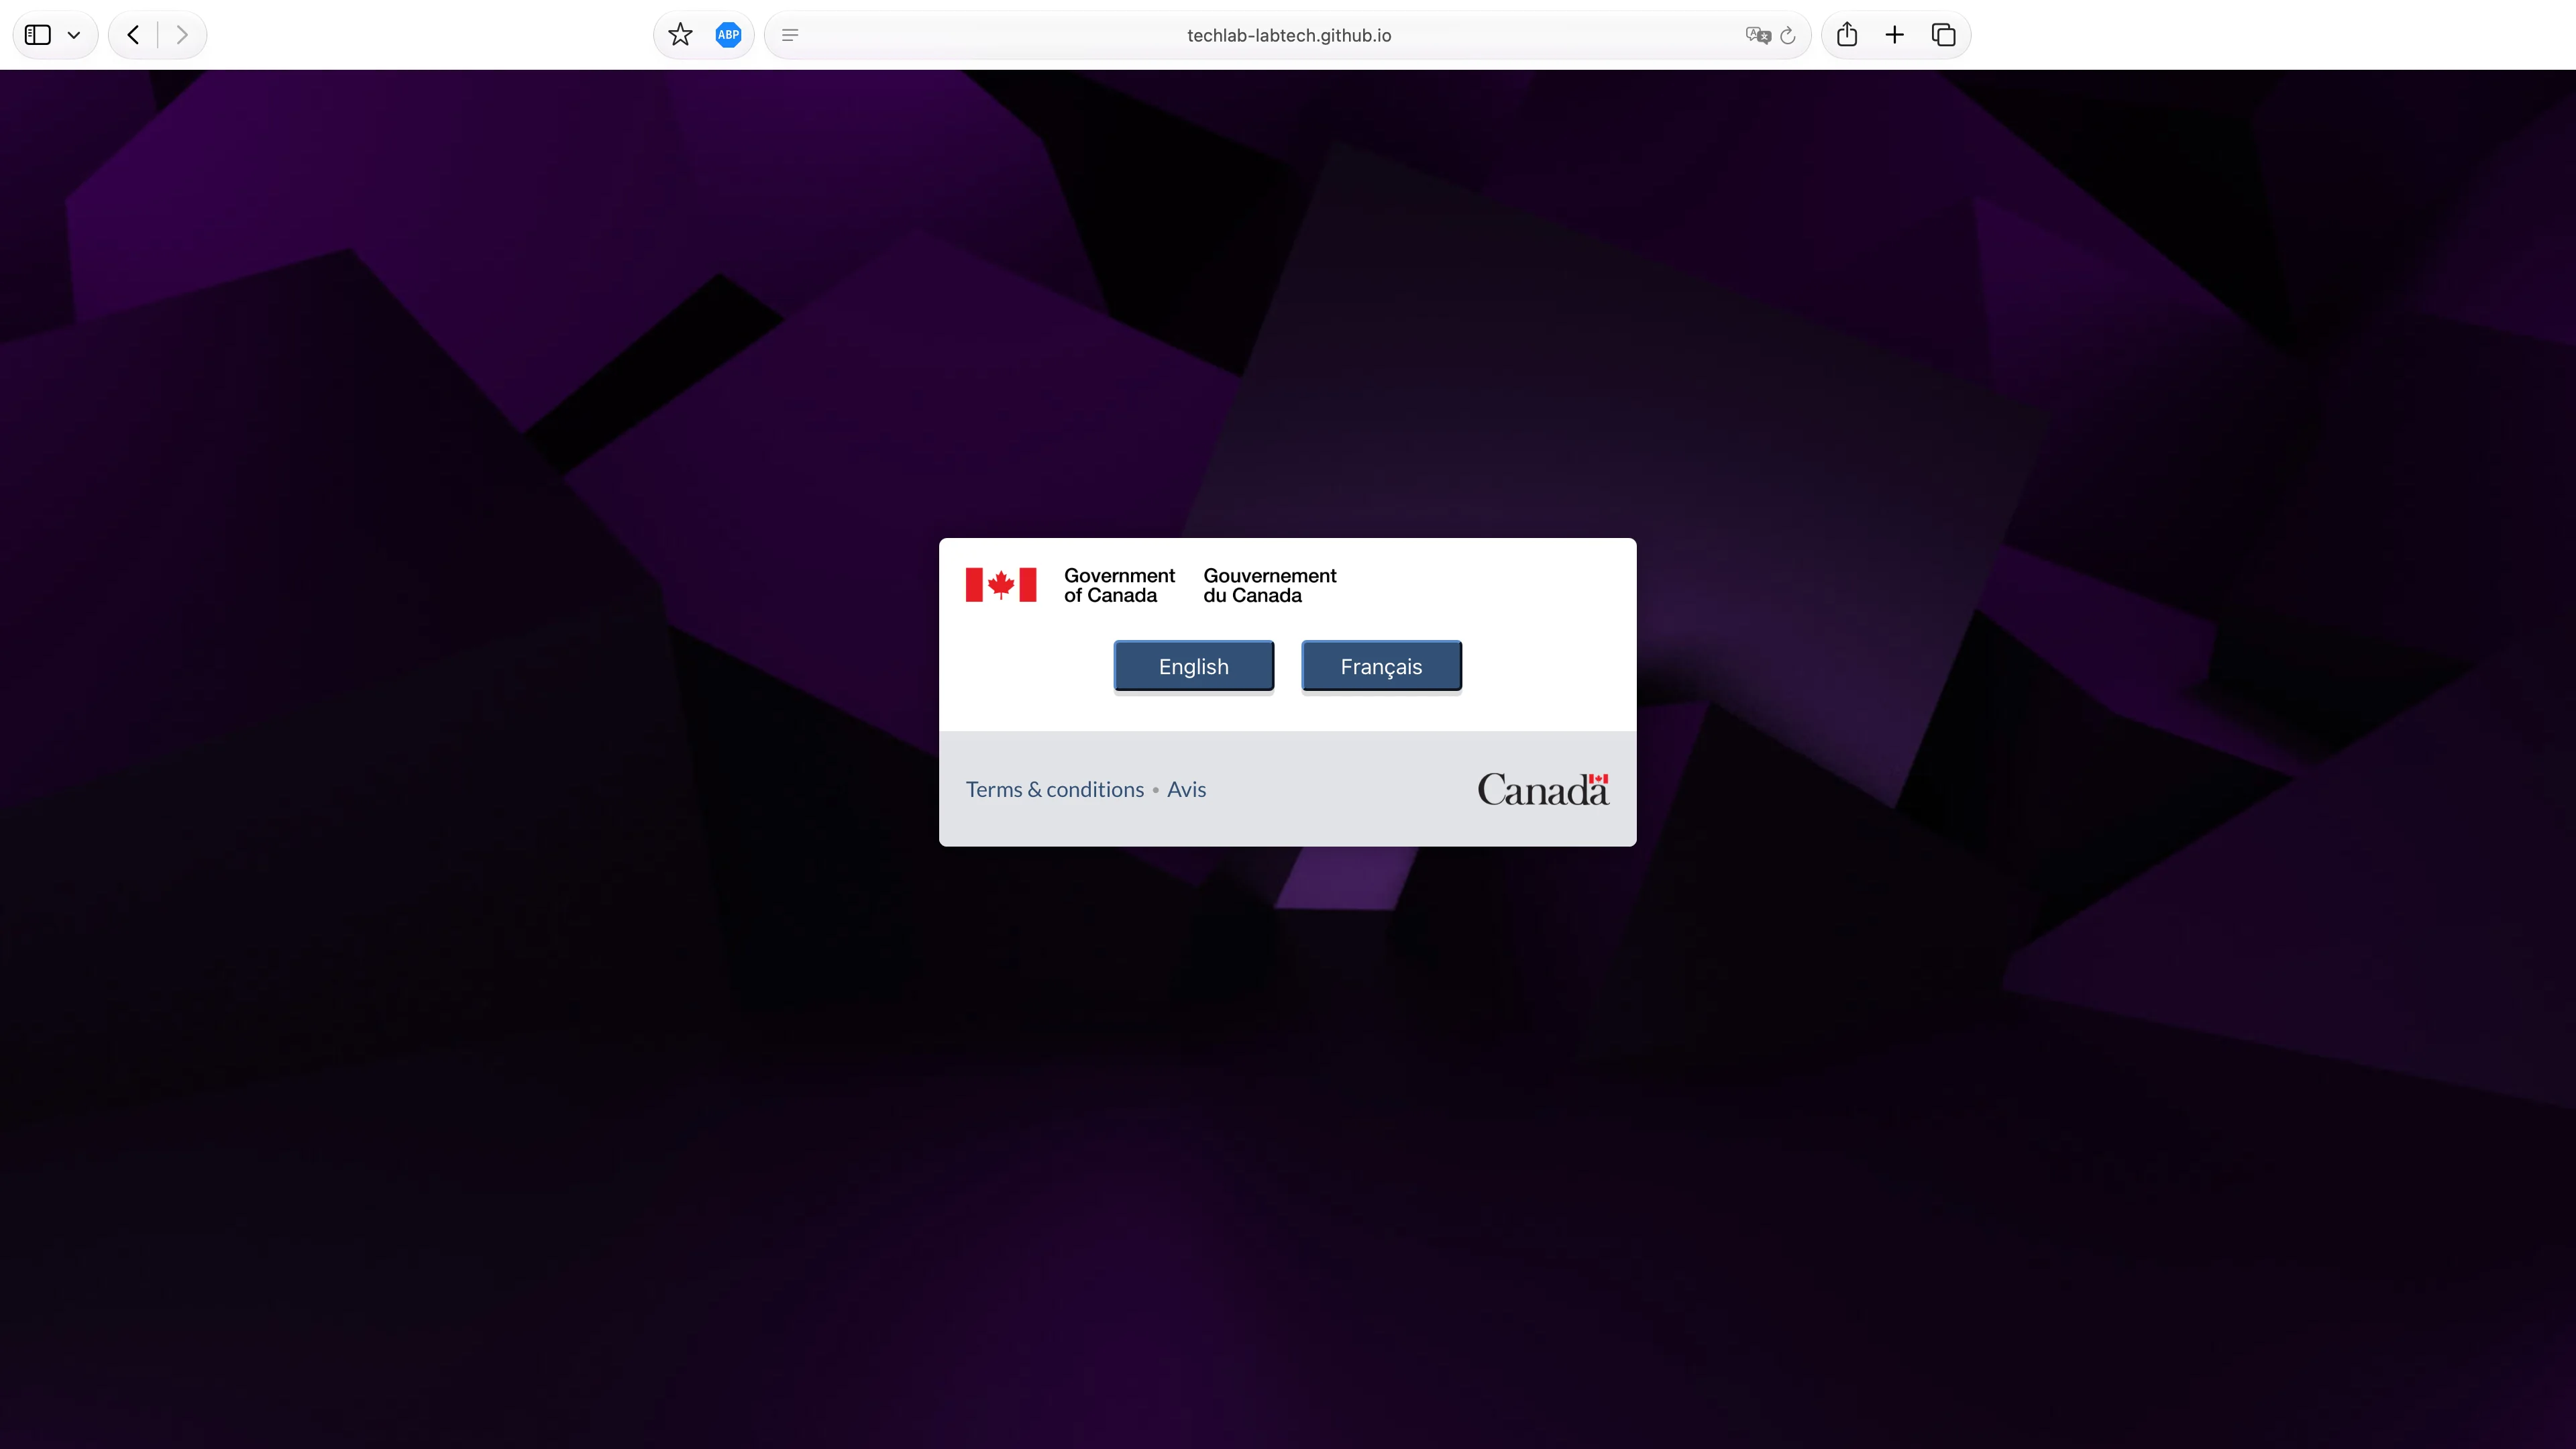
vExpo began as the Virtual Kiosk, a platform I led the development of at the Canada School of Public Service to bring conferences and events online during the COVID-19 pandemic. The platform recreated the experience of an in-person event through custom interactive booths, live presentations and bilingual content, allowing participants to explore and engage with events virtually. The project was later expanded and renamed vExpo, with my work leading its development recognized with a 2020 President’s Award. Due to the confidential nature of event content, only a sample of the platform’s main interface and language selection are shown here.
- React
- JavaScript
- HTML
- CSS
- Google Analytics
Swipey.js
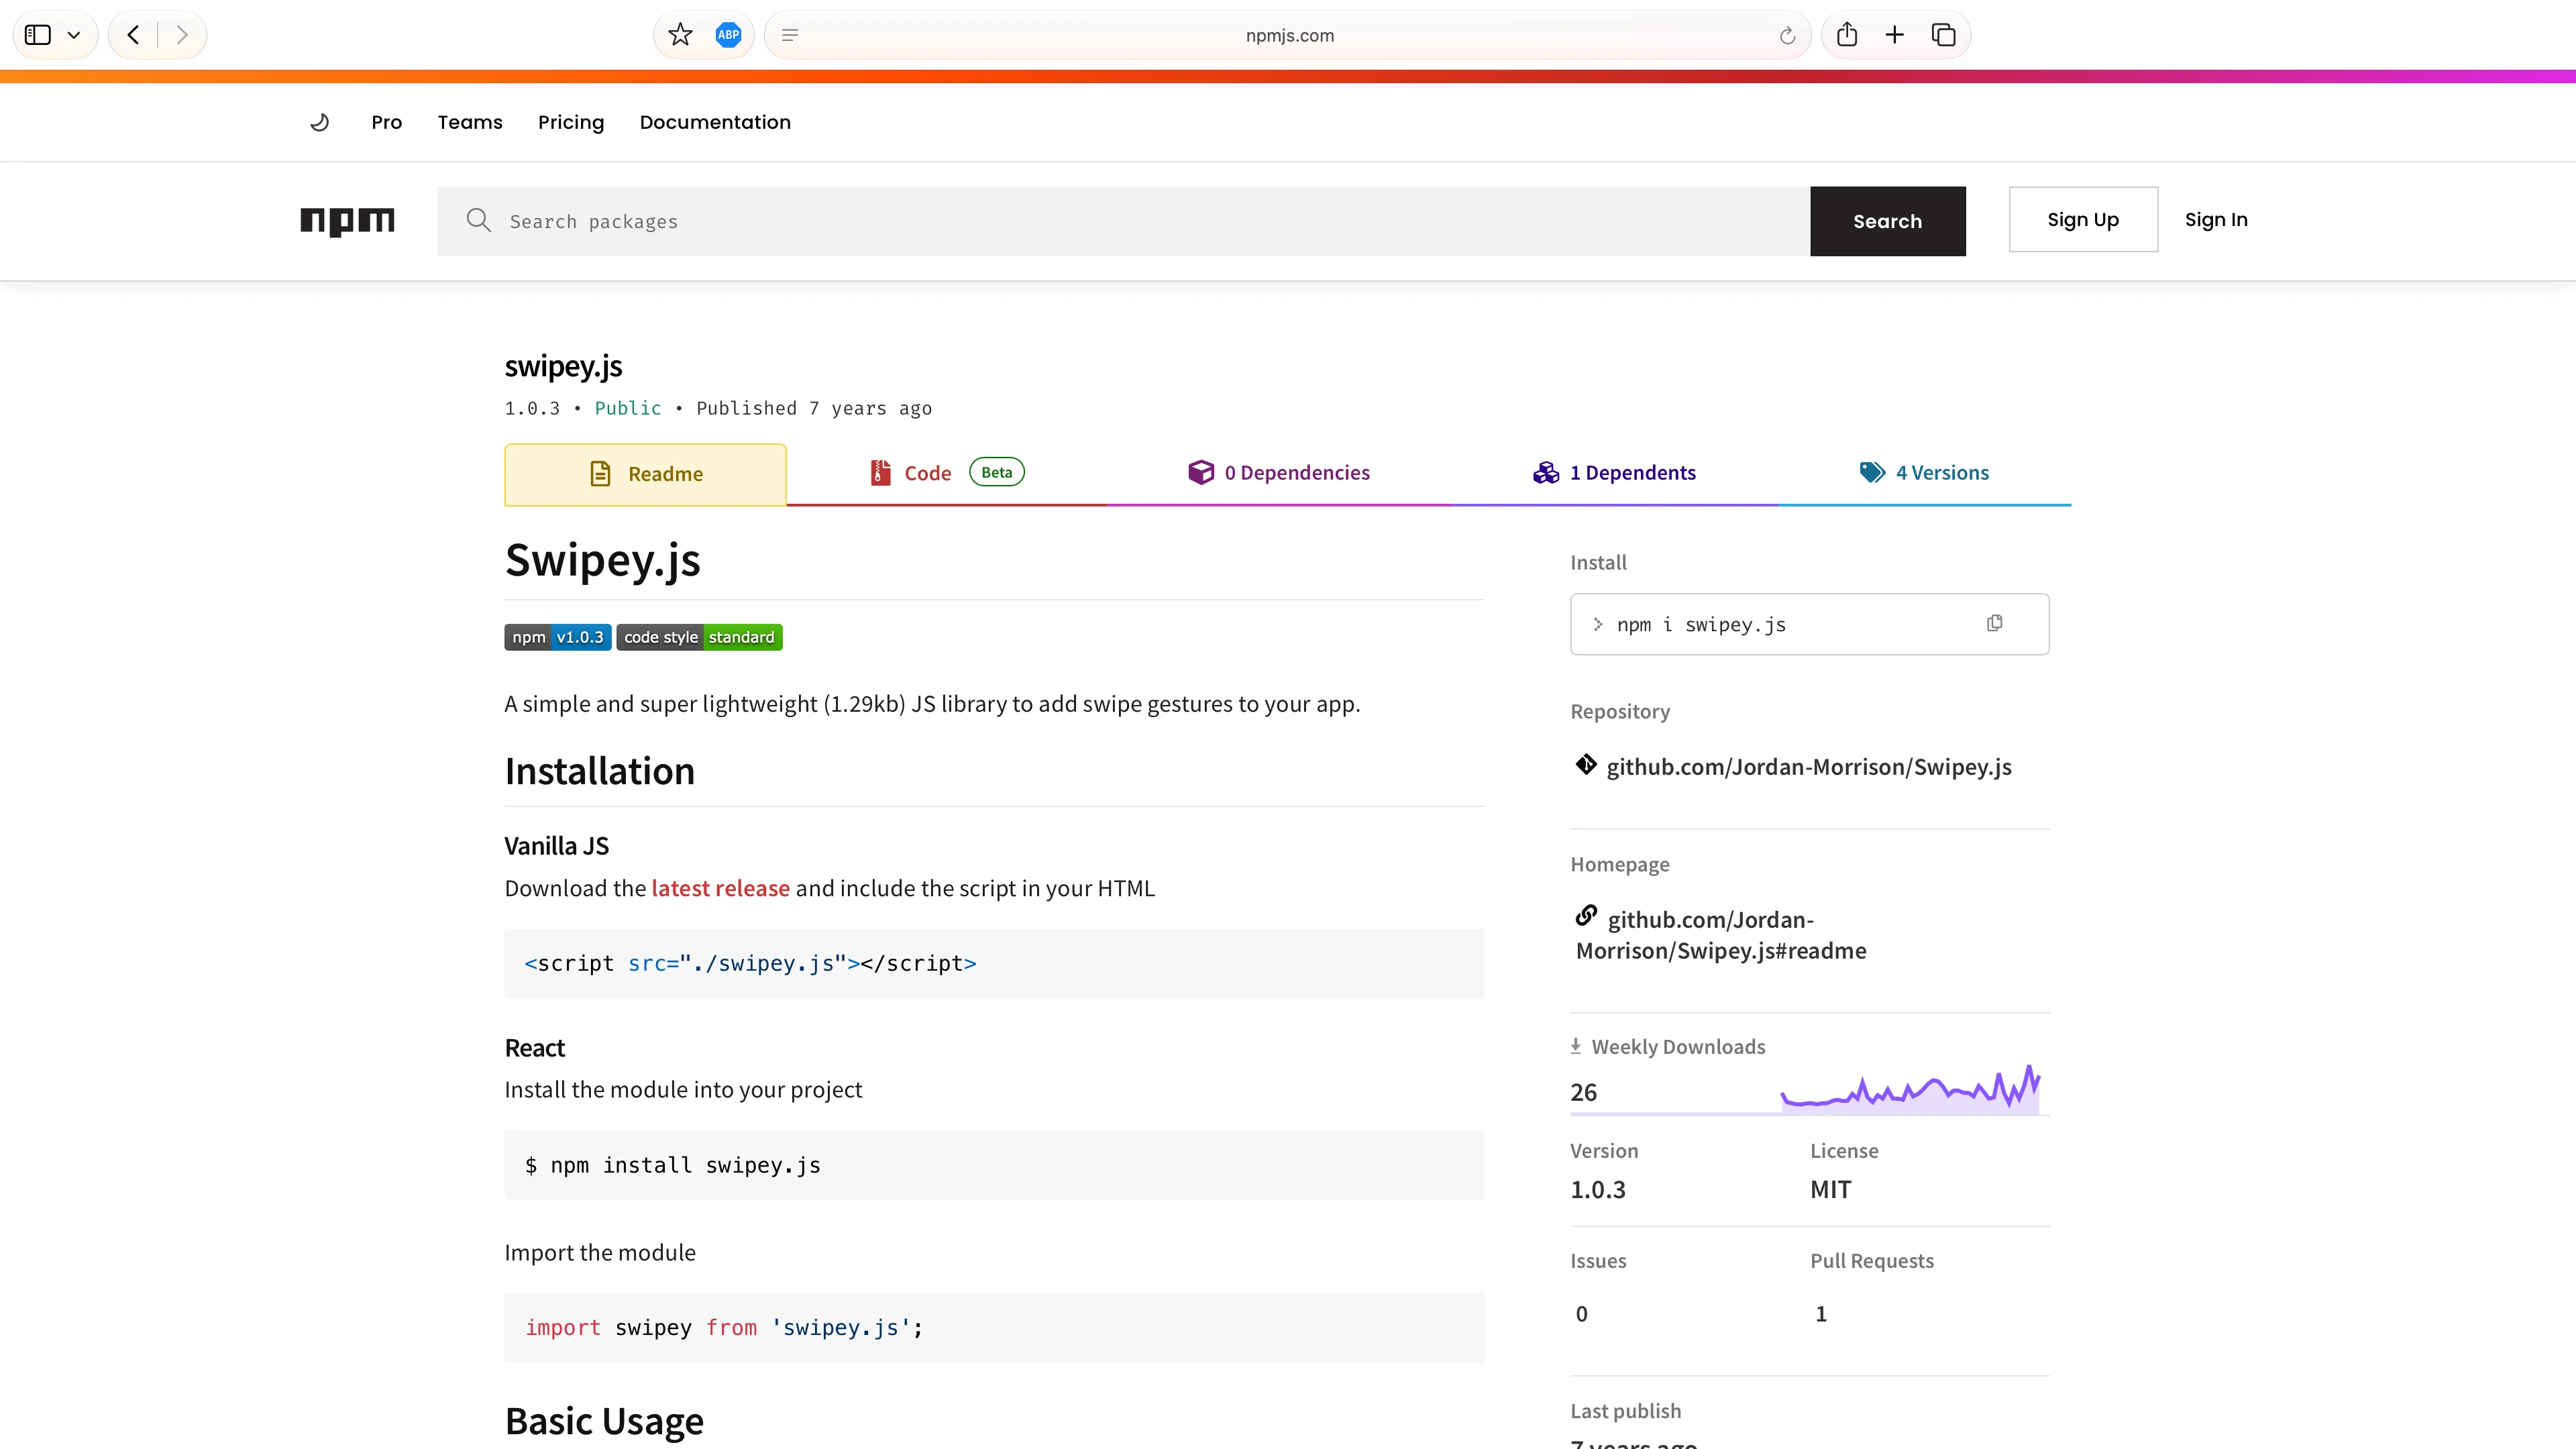
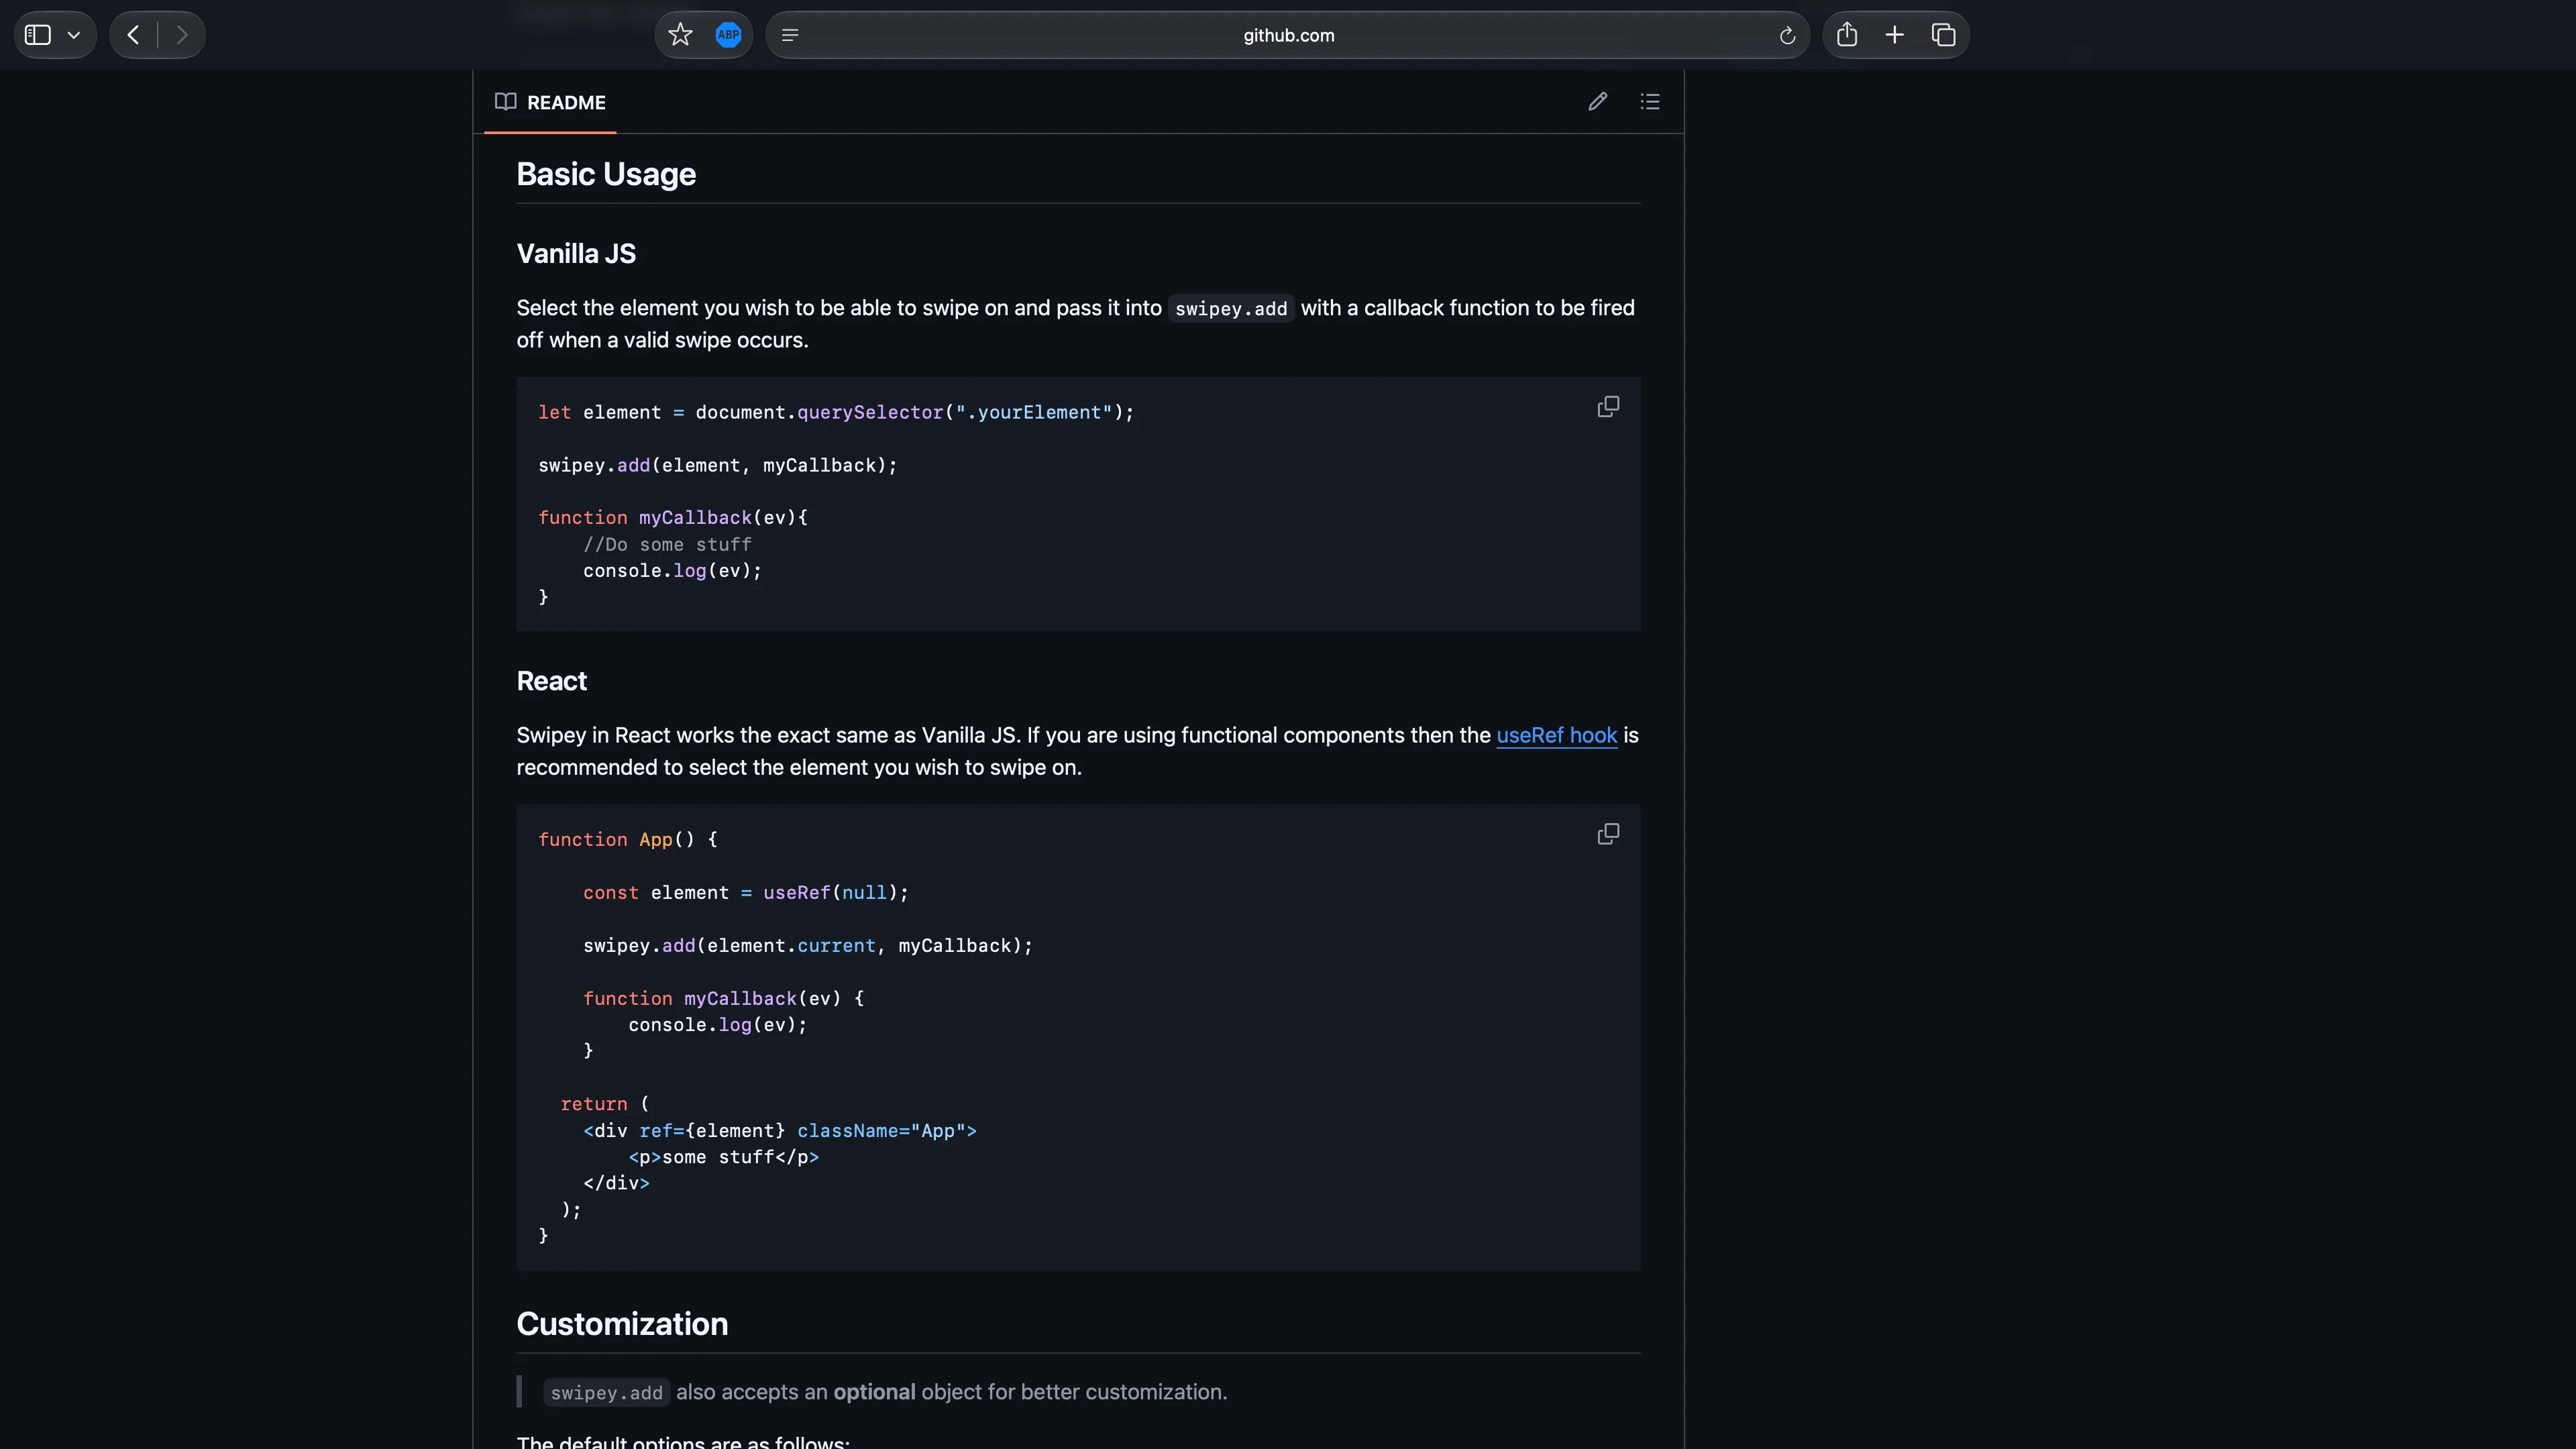
Swipey.js is a lightweight JavaScript library I designed, developed and published to NPM to make adding swipe gestures to web applications simple and flexible. At just 1.29 KB with zero dependencies, the library works with both Vanilla JavaScript and React while providing configurable support for horizontal, vertical and diagonal gestures. Developing the package involved creating a straightforward API, handling touch interactions and gesture detection, and packaging the library for easy integration across different projects.
- JavaScript
- Node.js

React Child Lock
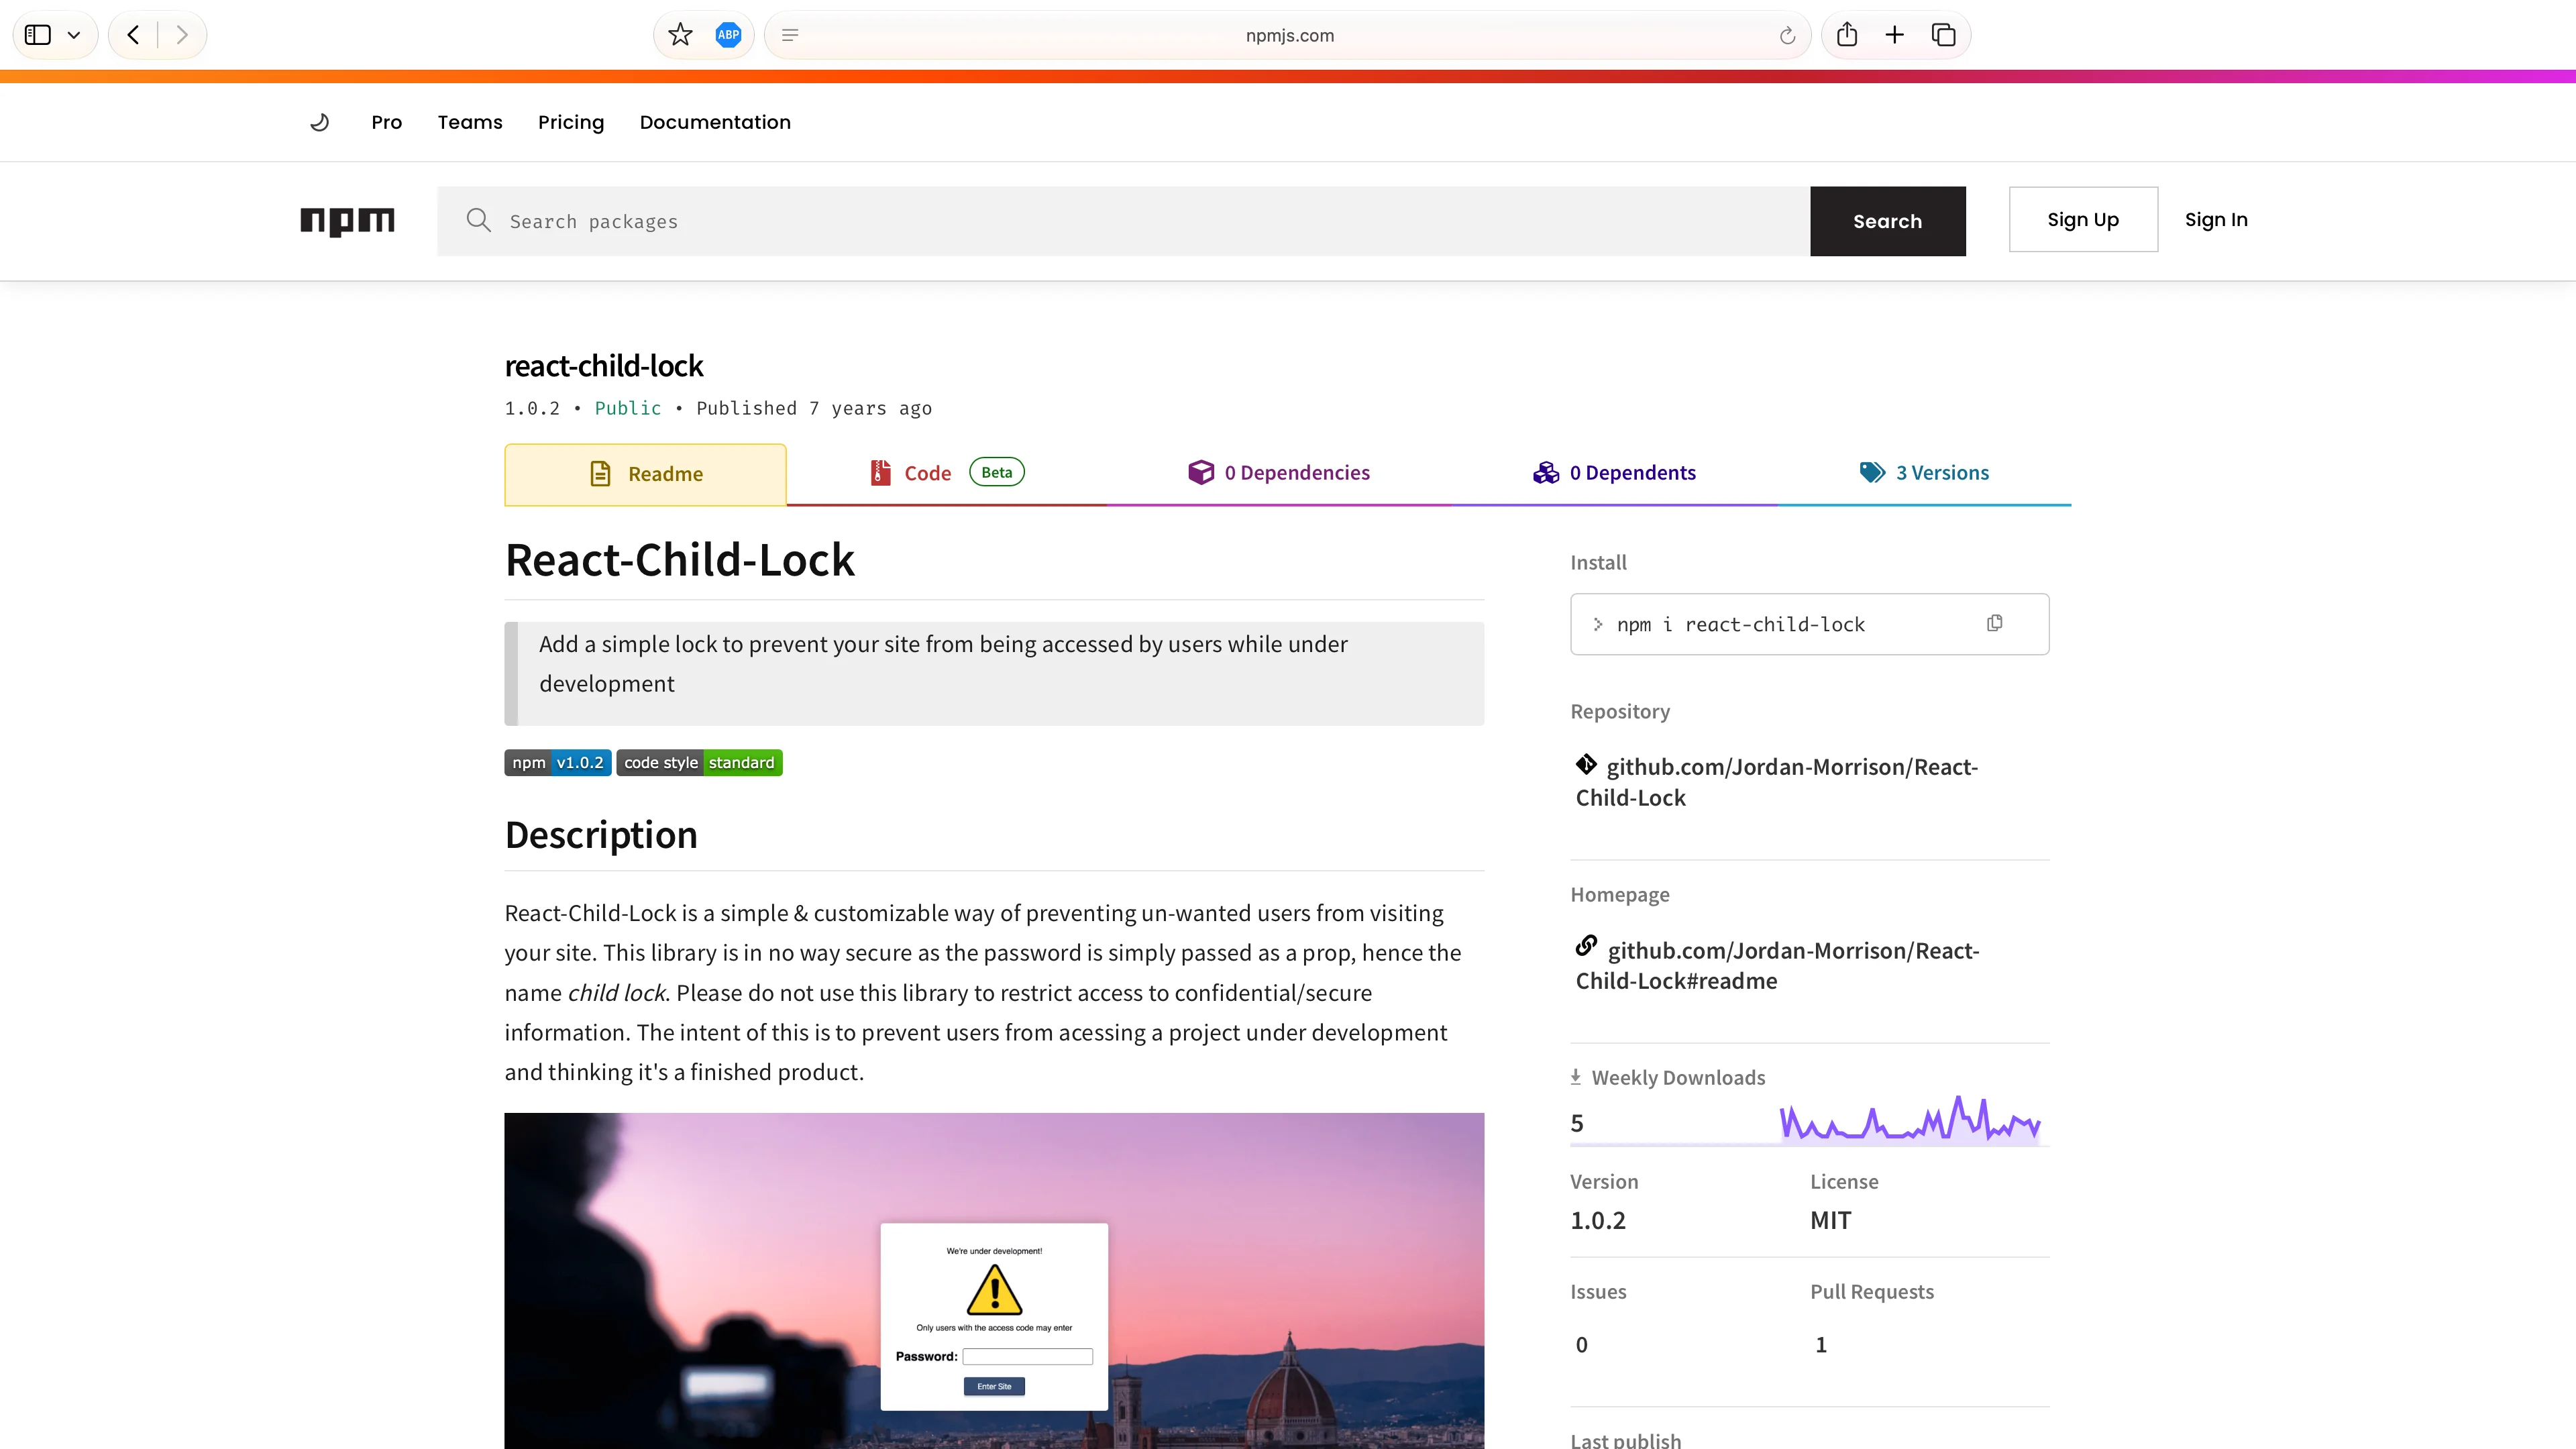
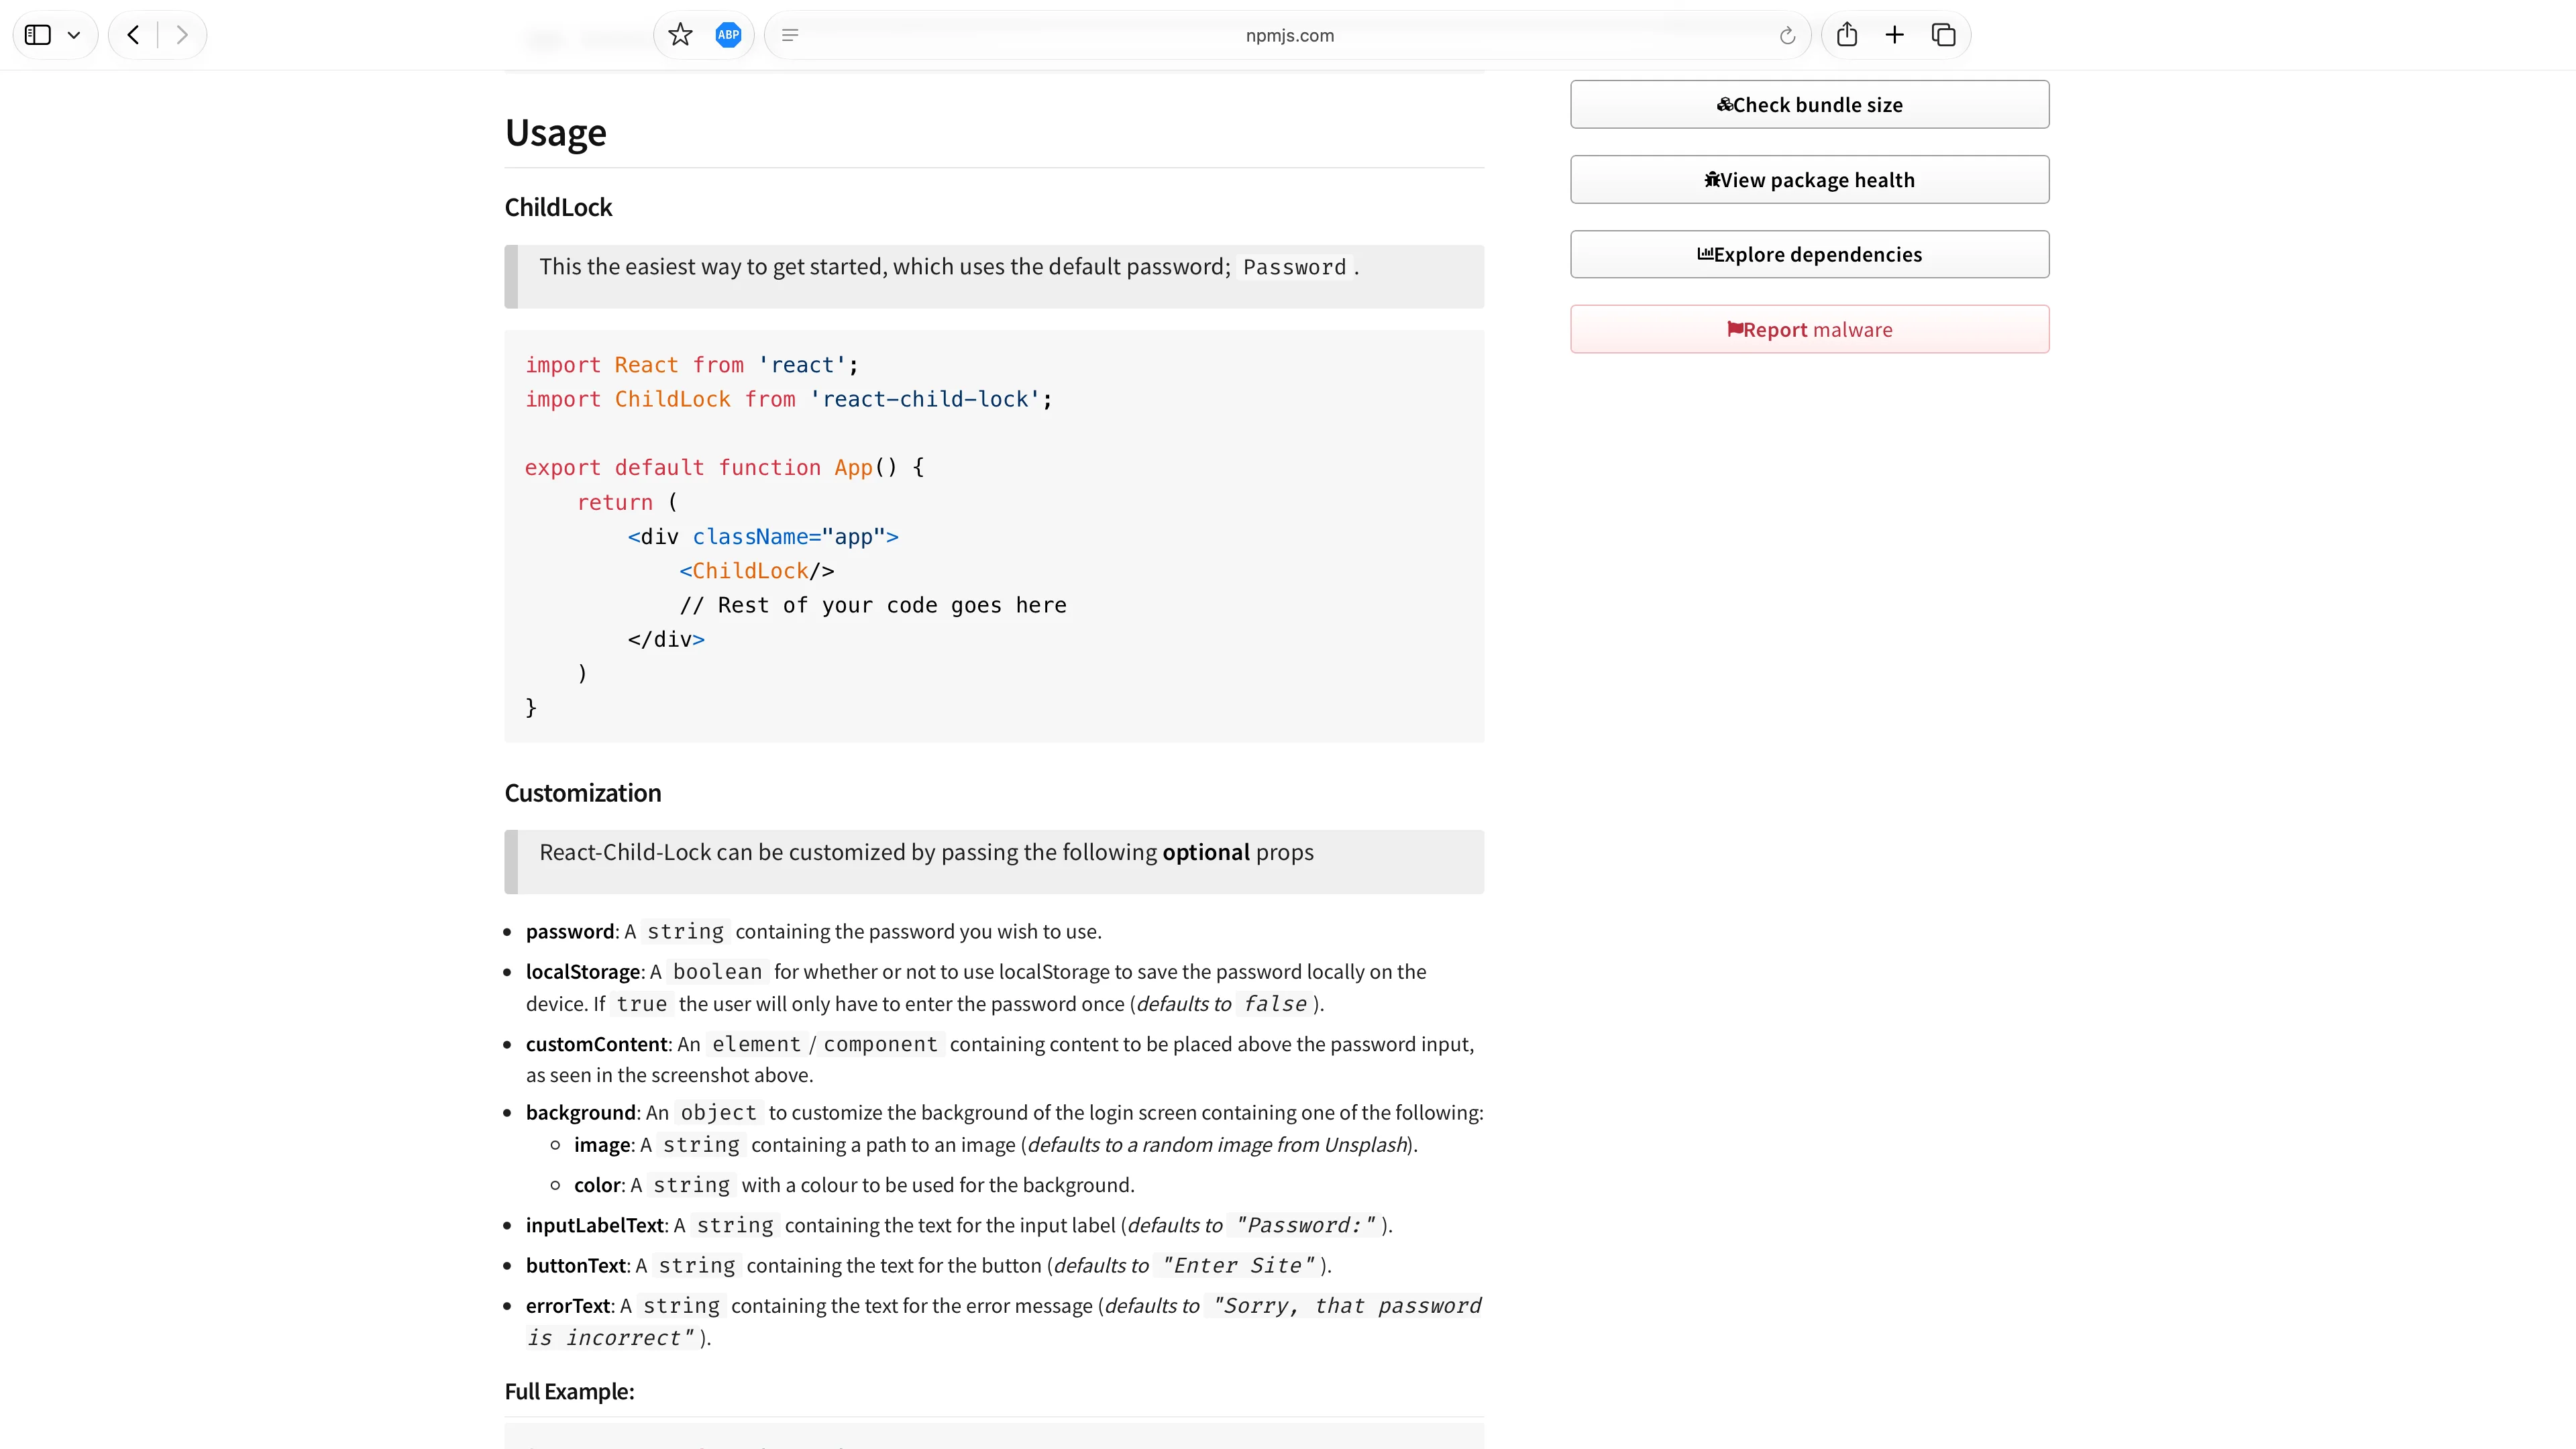
React Child Lock is a lightweight React component I designed, developed and published to NPM to provide a simple way of restricting access to websites while they are under development. Built with reusability and customization in mind, the package allows developers to quickly add a configurable lock screen to a React project without building the functionality from scratch. Developing the package involved designing a flexible component API, packaging it for use across different projects and maintaining it as a publicly available open-source dependency.
- React
- JavaScript
- Node.js
- HTML
- CSS
Gel Calculator
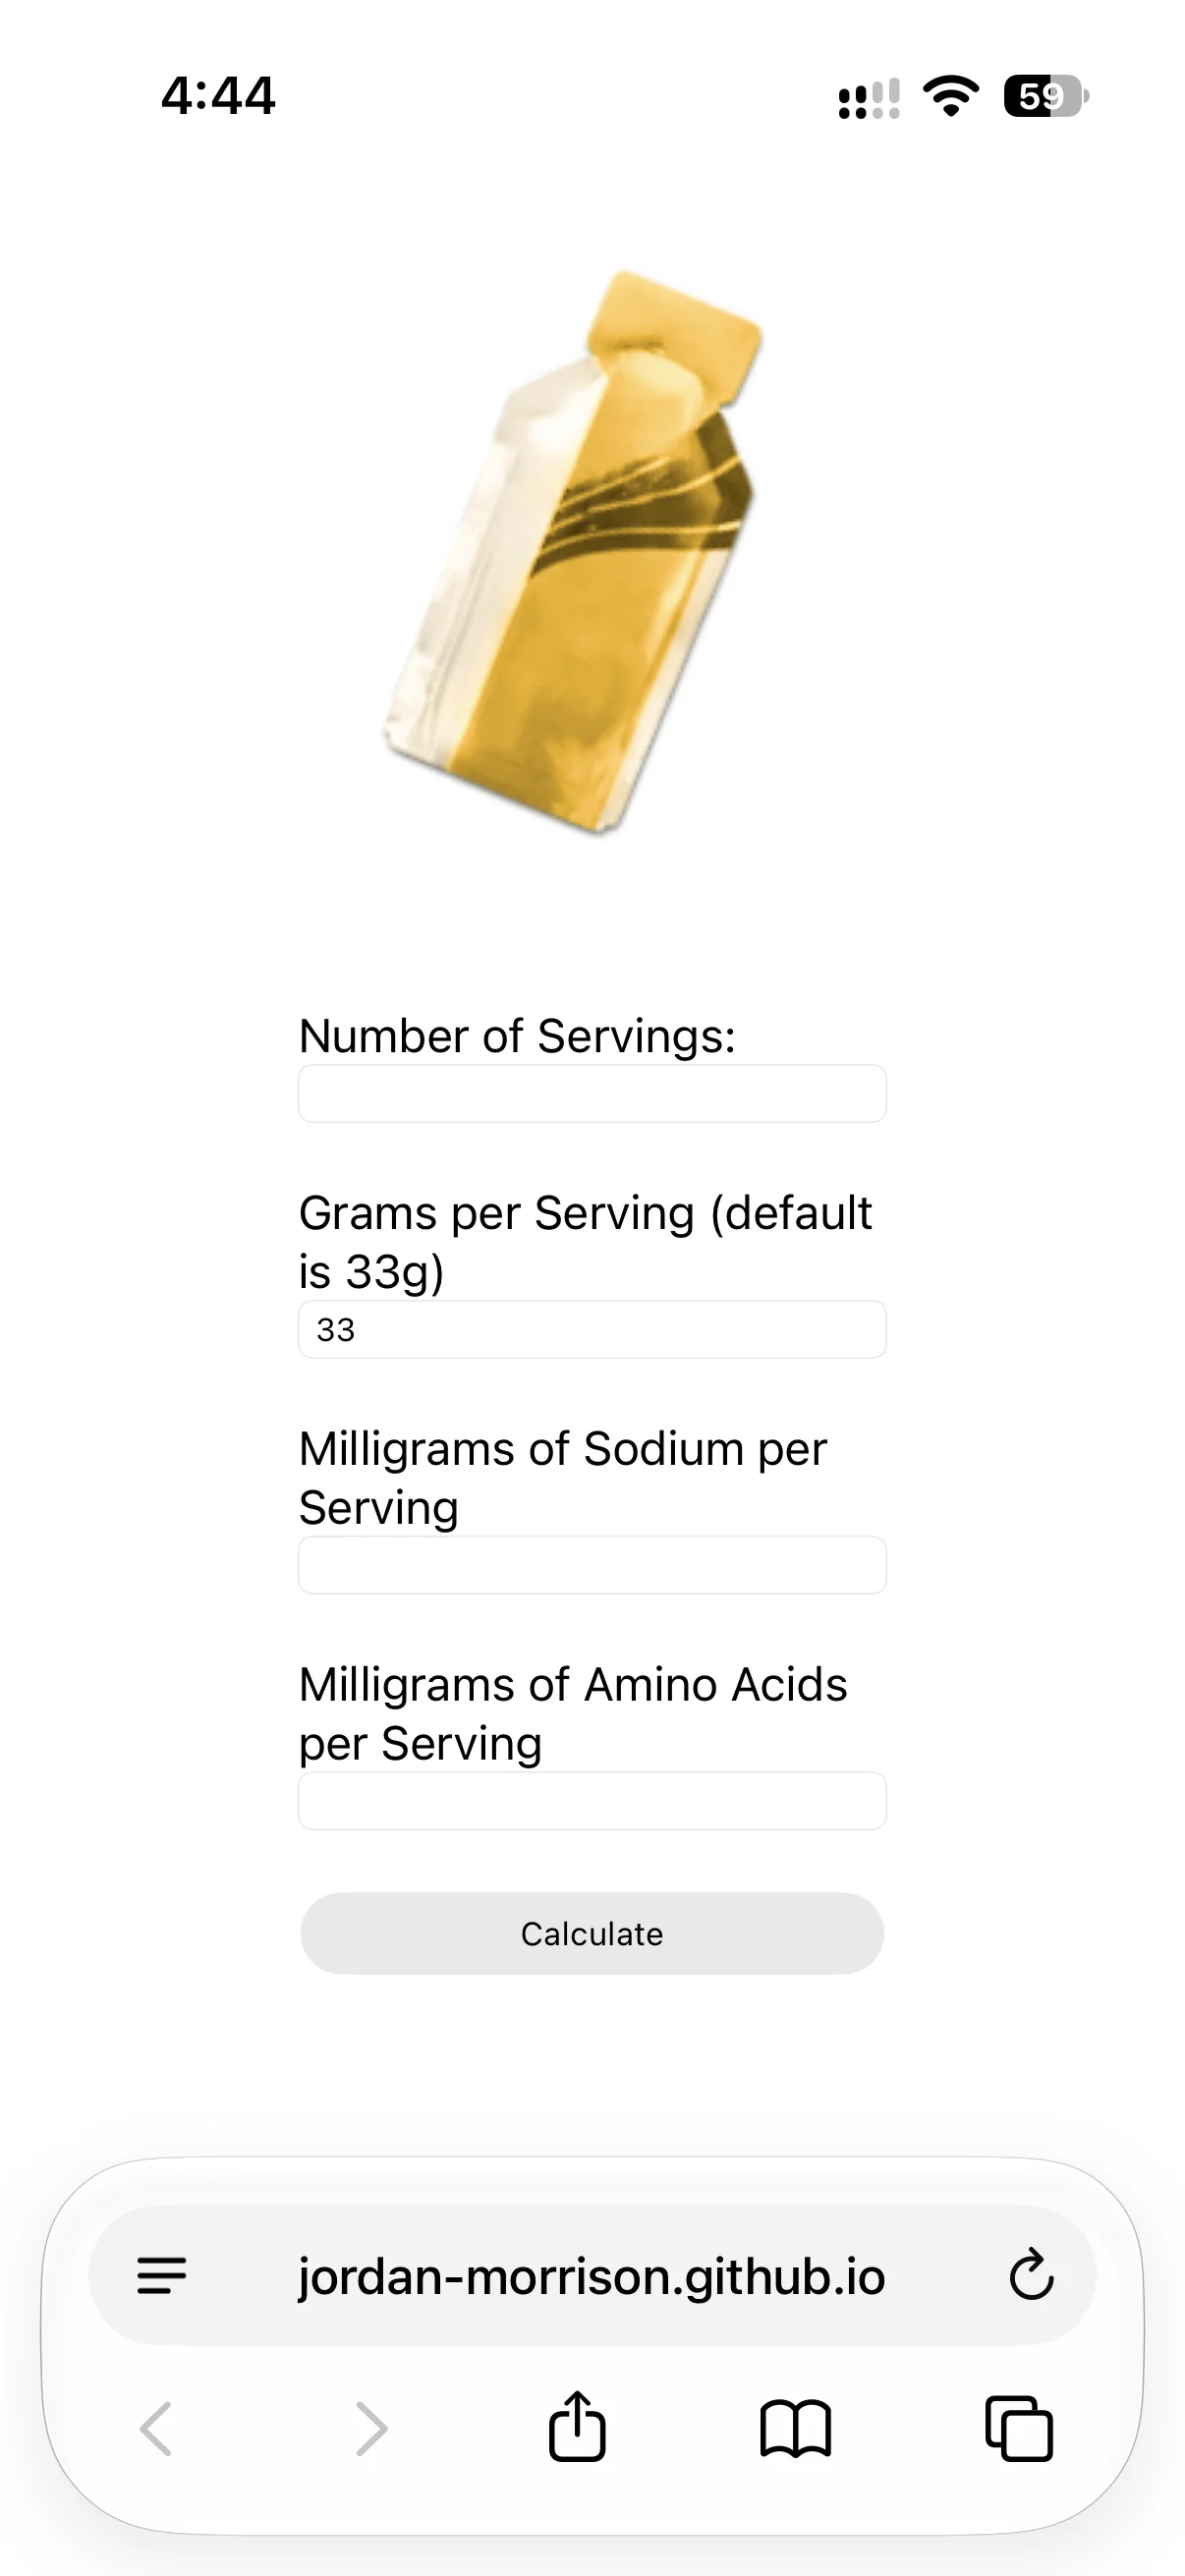
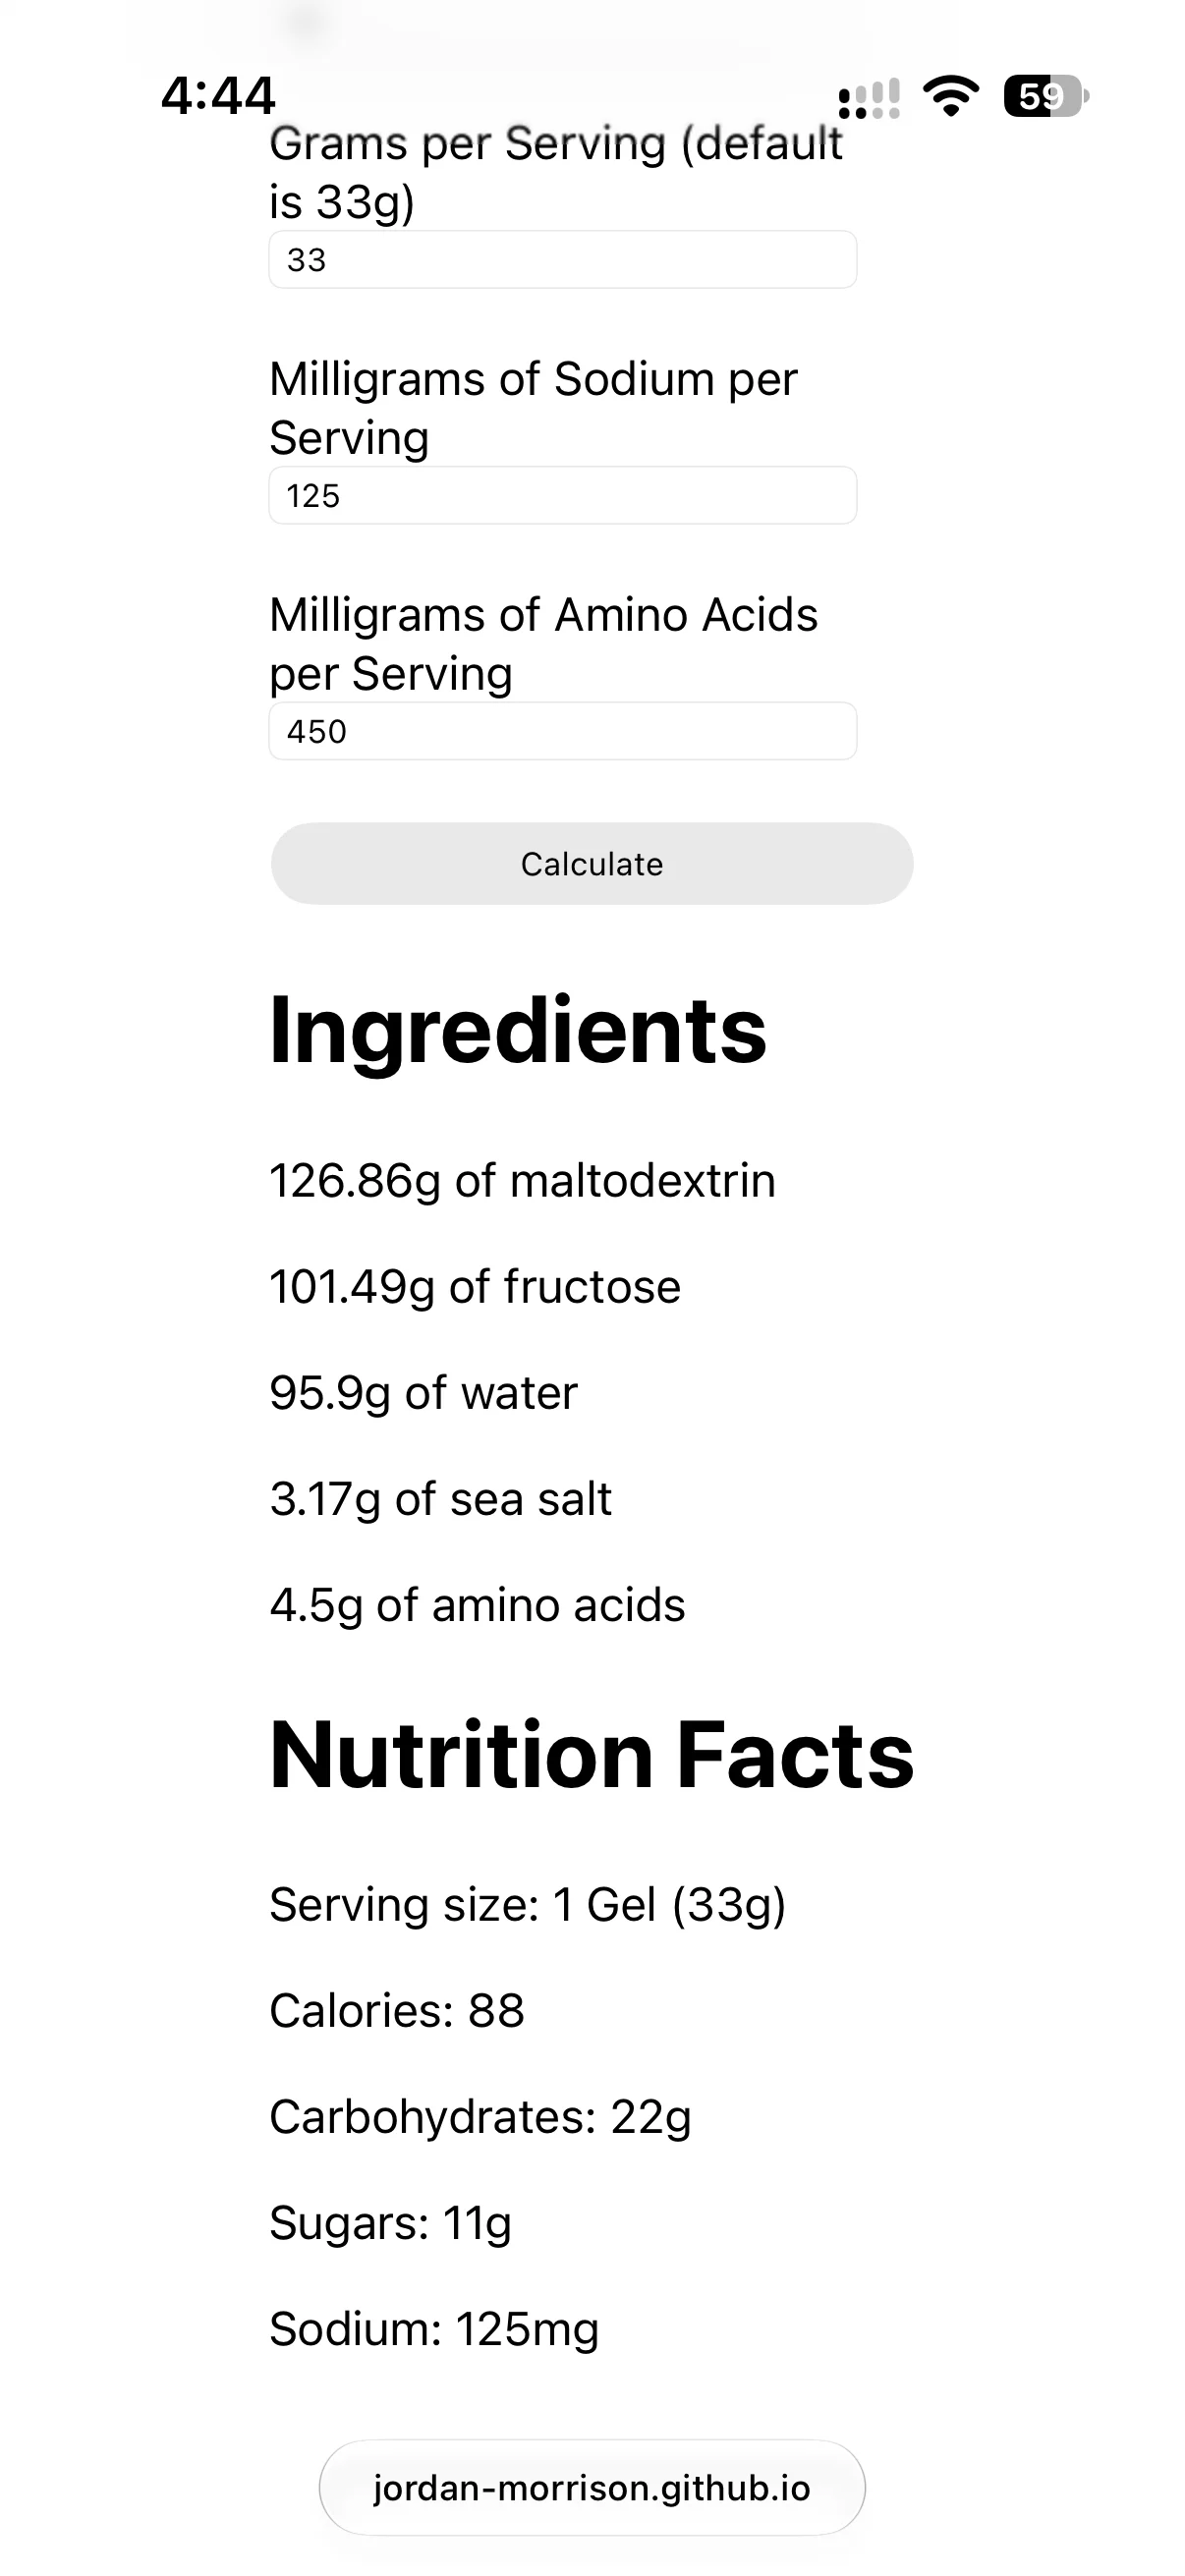
The Gel Calculator is a very simple web app I built to make preparing my own endurance fuel easier and more consistent. Users can enter the number and size of gels they want to make, along with their desired sodium and amino acids per serving, and the calculator determines the ingredients needed for the complete batch. Originally created purely as a personal tool, it has since been shared with friends and other athletes interested in making their own gels at a fraction of the cost of commercial options. The project remains intentionally simple, with plans to expand its functionality and interface in the future.
- React
- JavaScript
- HTML
- CSS
- Pixelmator Pro
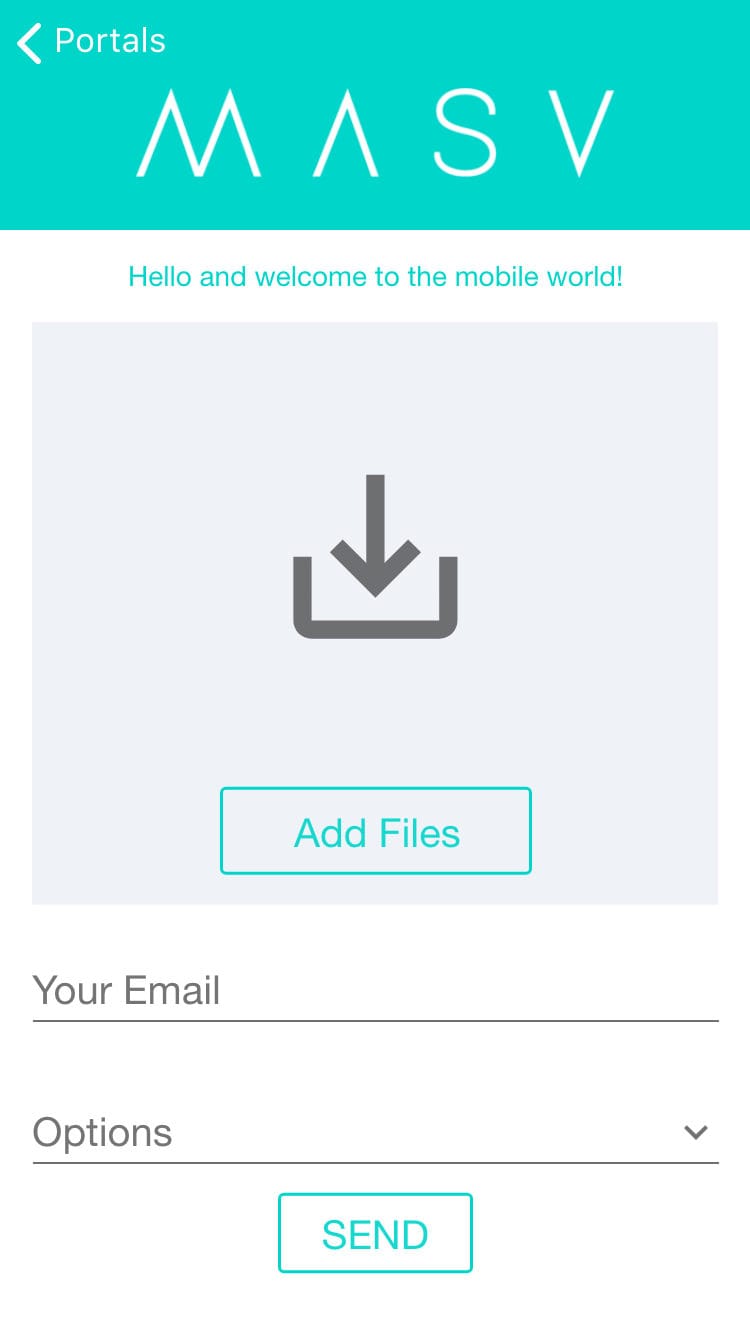
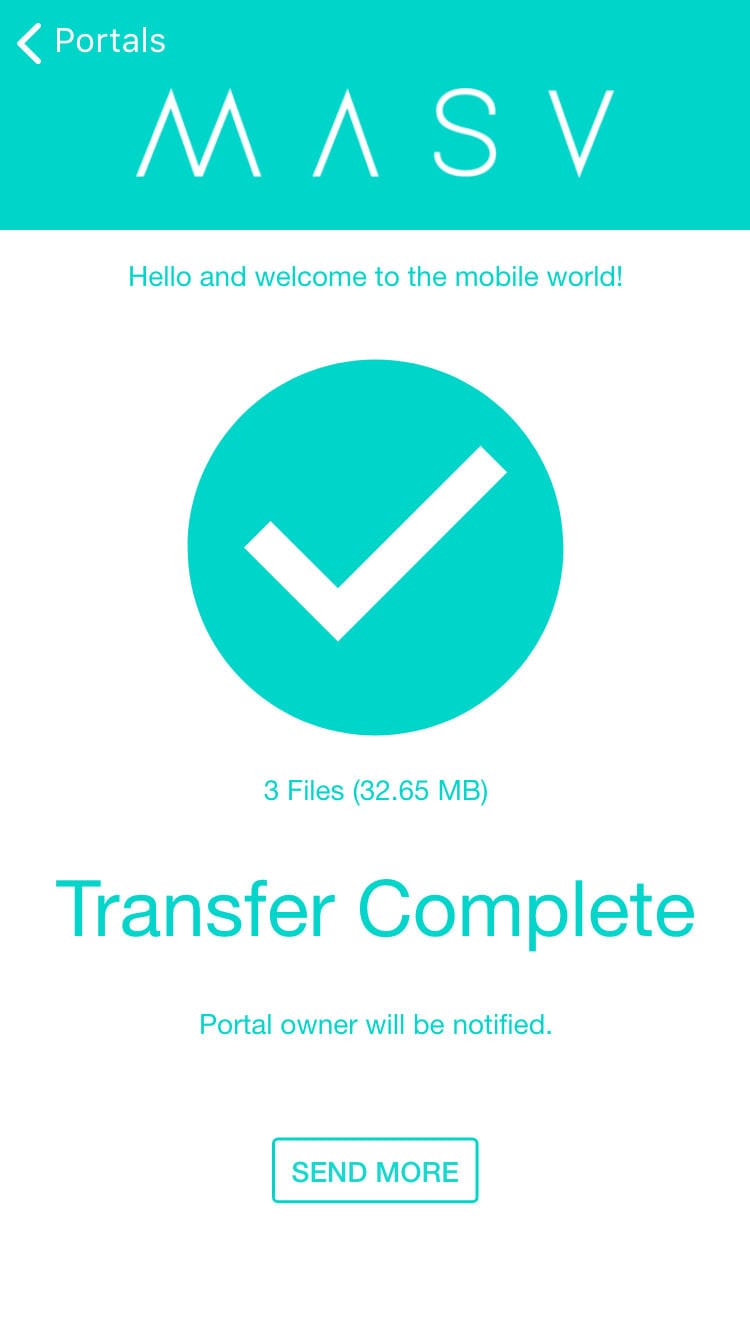
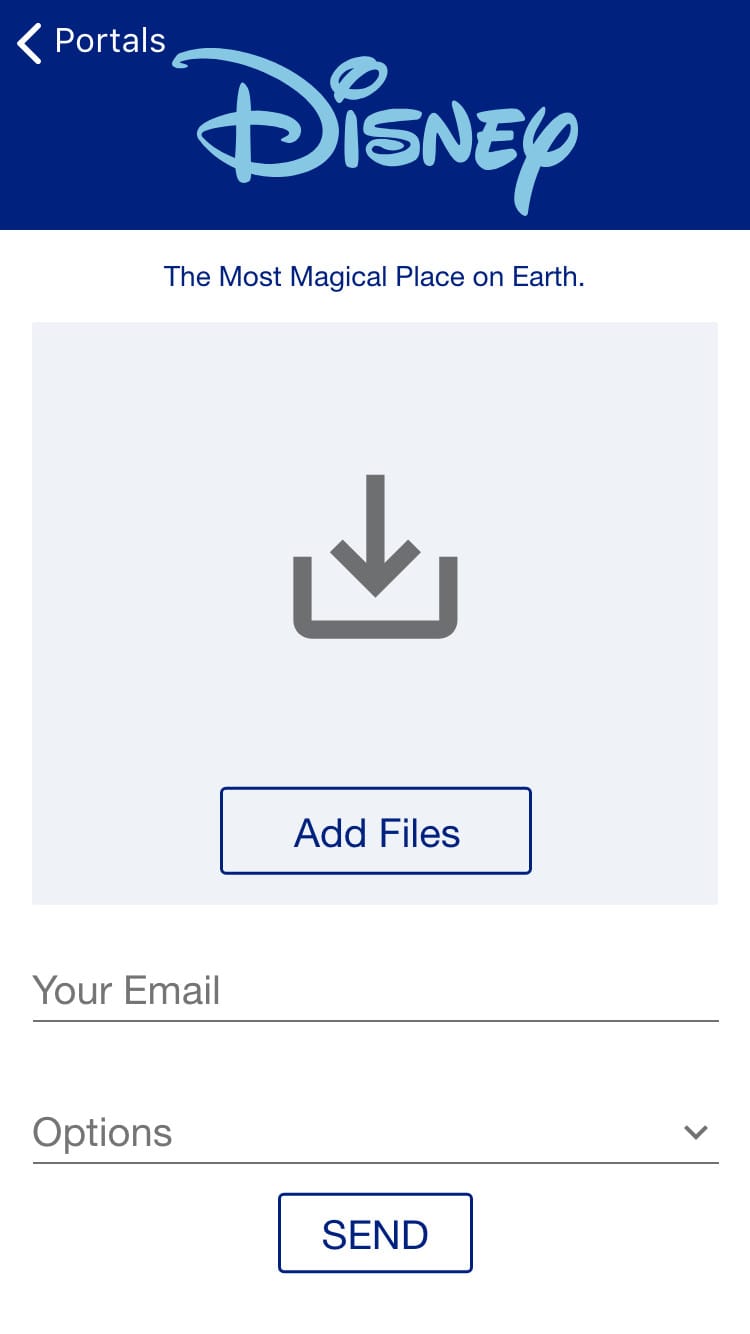
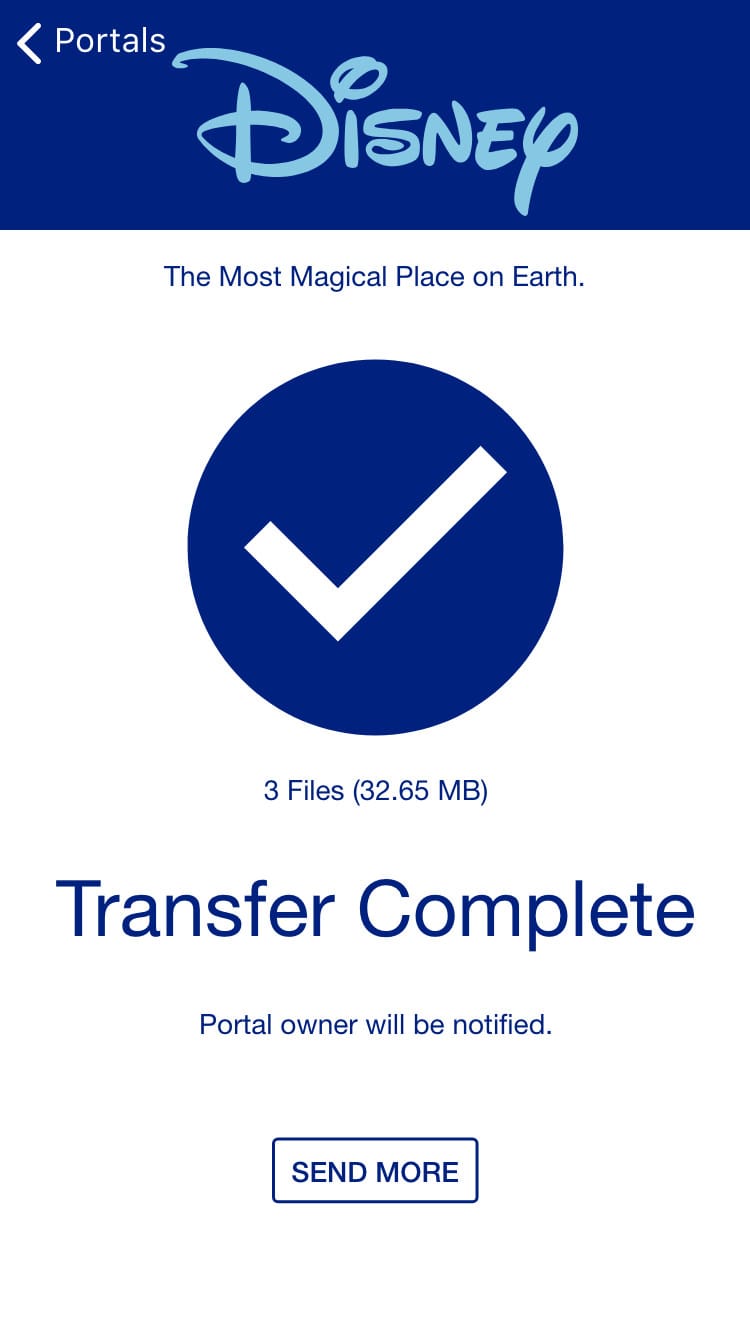
MASV Mobile
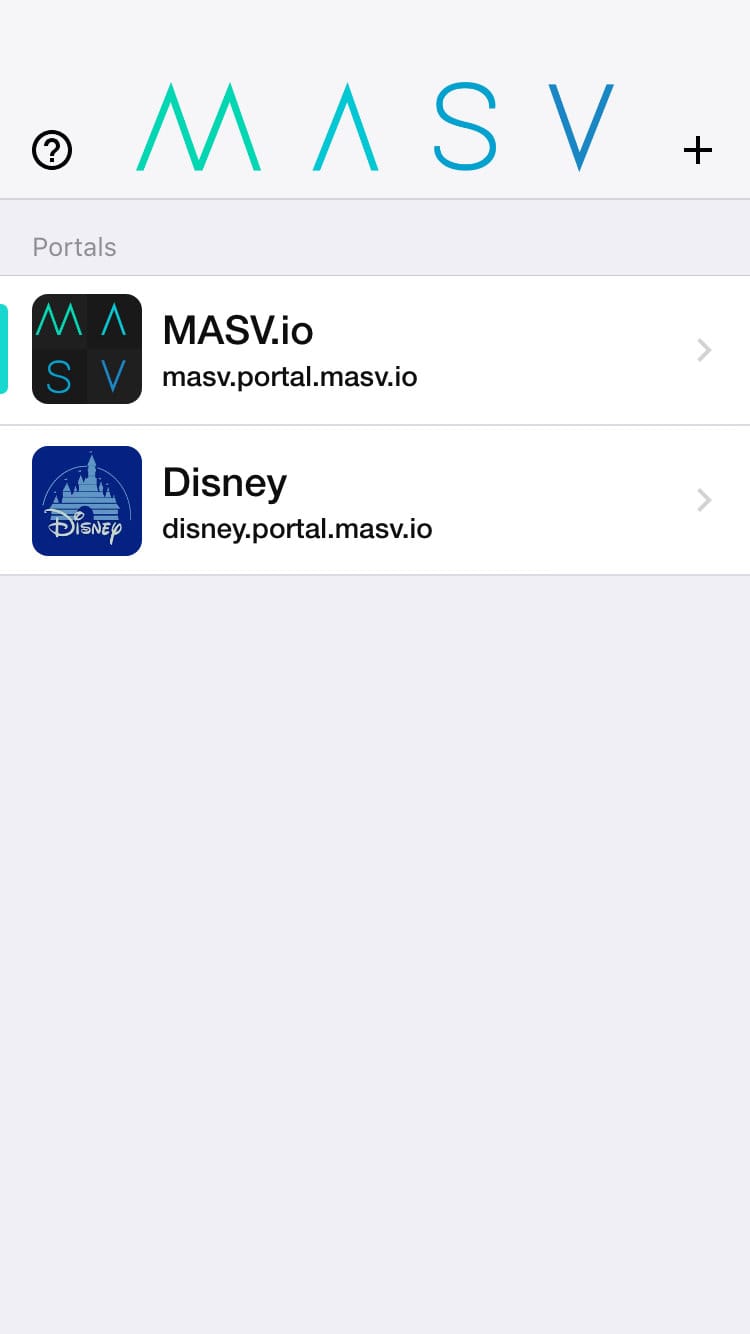
MASV Mobile is a team based applied research project through Algonquin College, being built for MASV to compliment their existing products. The goal for the app was to support MASV Portals, which are setup by companies & creative professionals who wish to crowdsource files. Portals are custom branded to reflect the hosting party, and can be accessed by users to upload files. My role was project lead, where I led our team of six throughout the entire design and development process. I worked closely with the team in all aspects as we designed & developed the app.
 Swift
Swift Figma
Figma
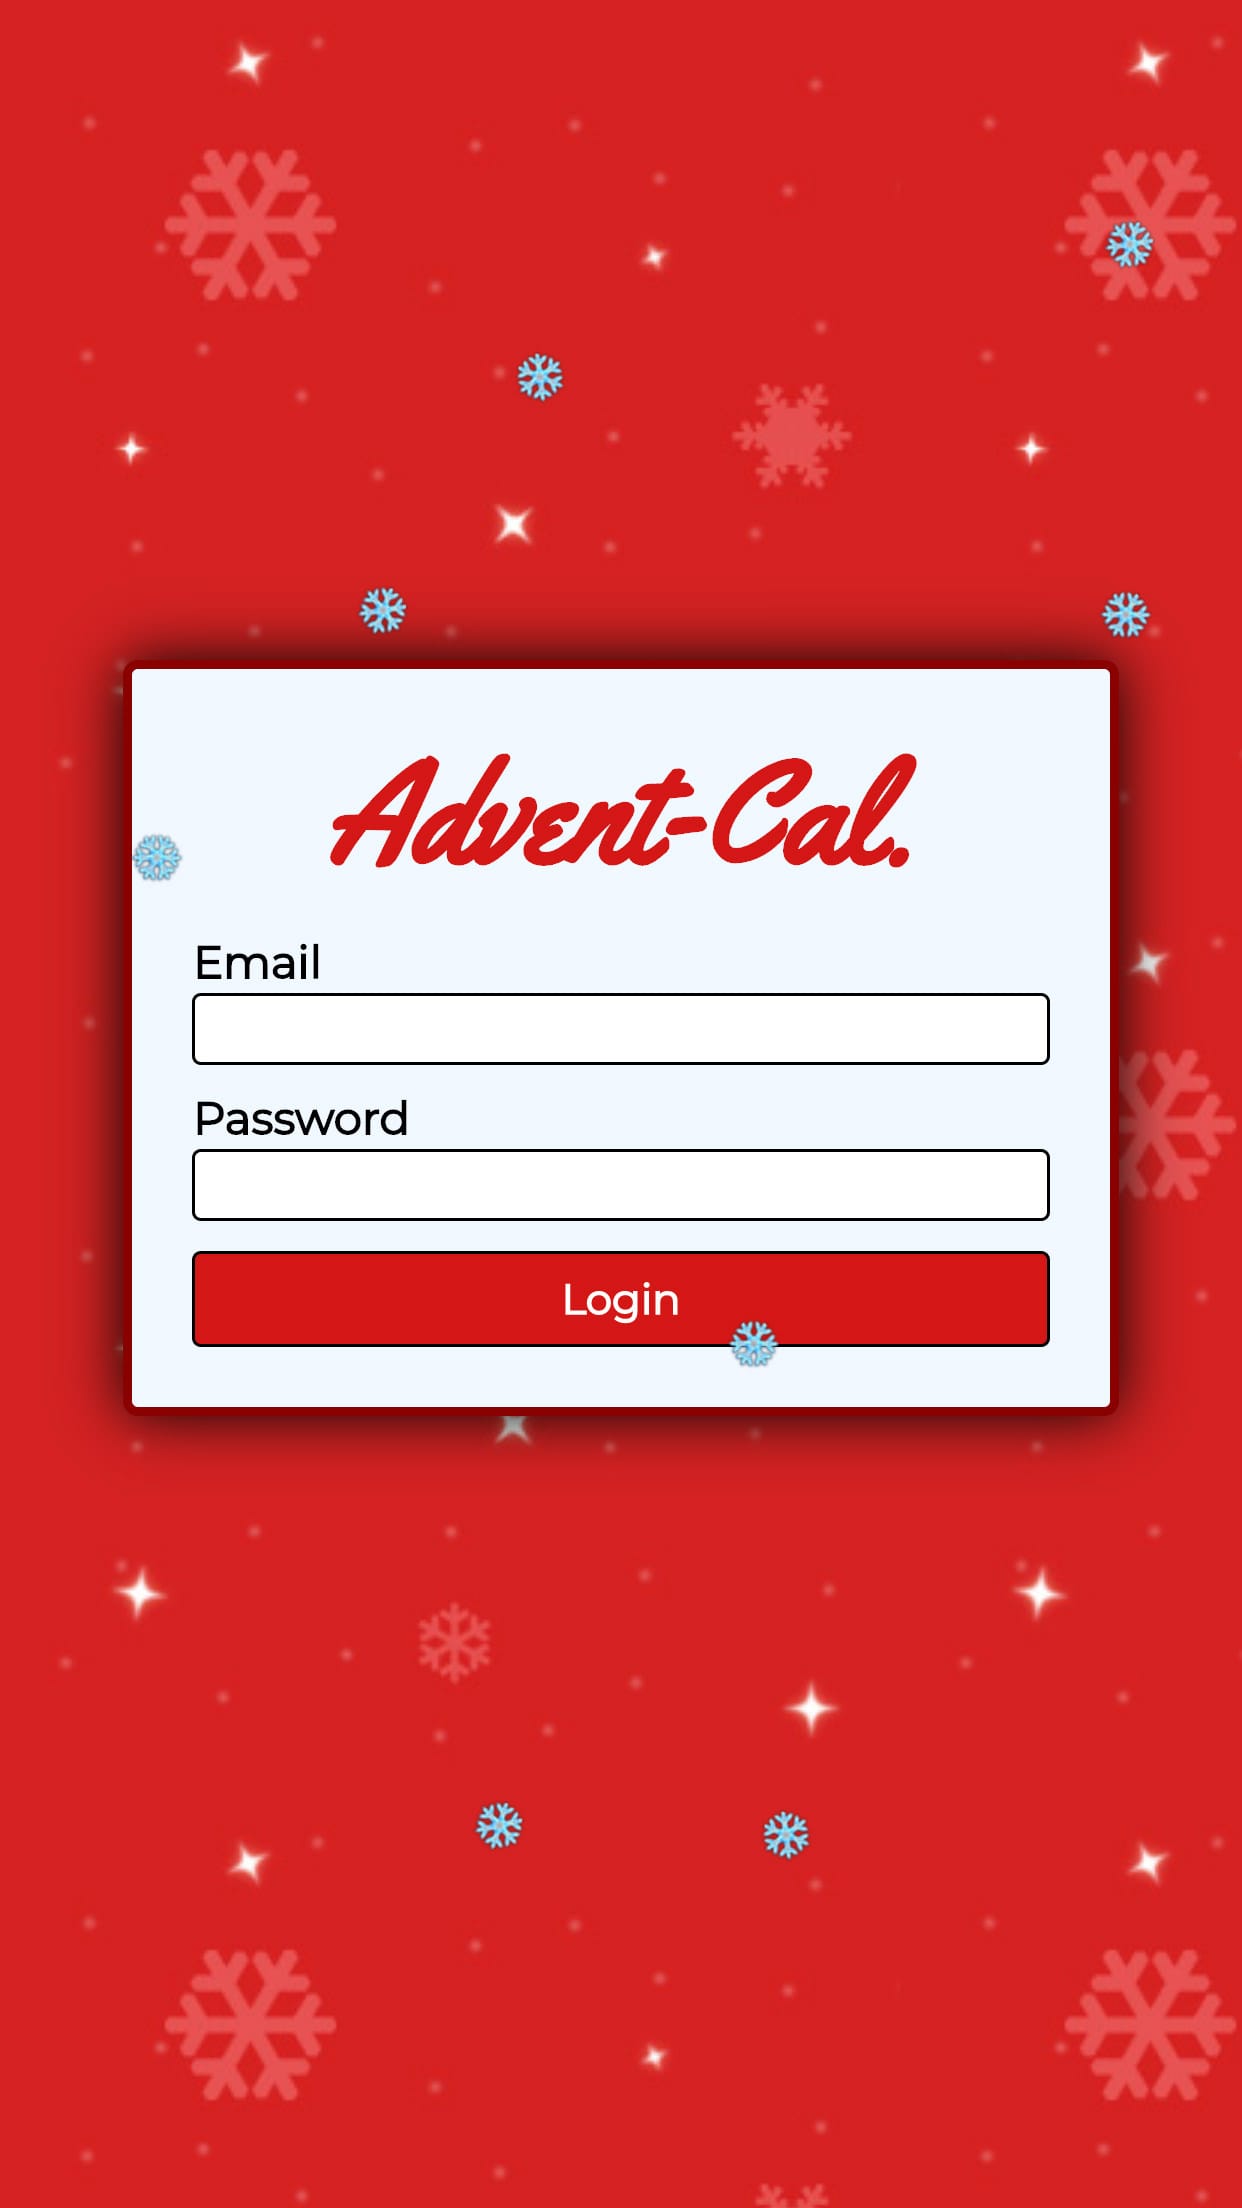


Advent Calendar
This advent calendar was a fun little gift for my family and everyday of December, up until Christmas it would give them a hint as to what their presents were going to be. The calendar was full of animations with snow constantly falling and gift wrap when opening a new day on the calendar. This project also featured a backend with email & password authentication using Firebase. This protected any leaks as only data up and until that day would be sent to the app from the server.
- Node.js
- MongoDB
- JavaScript
- HTML
- CSS
- Google Firebase
- Adobe Photoshop
 Canva
Canva
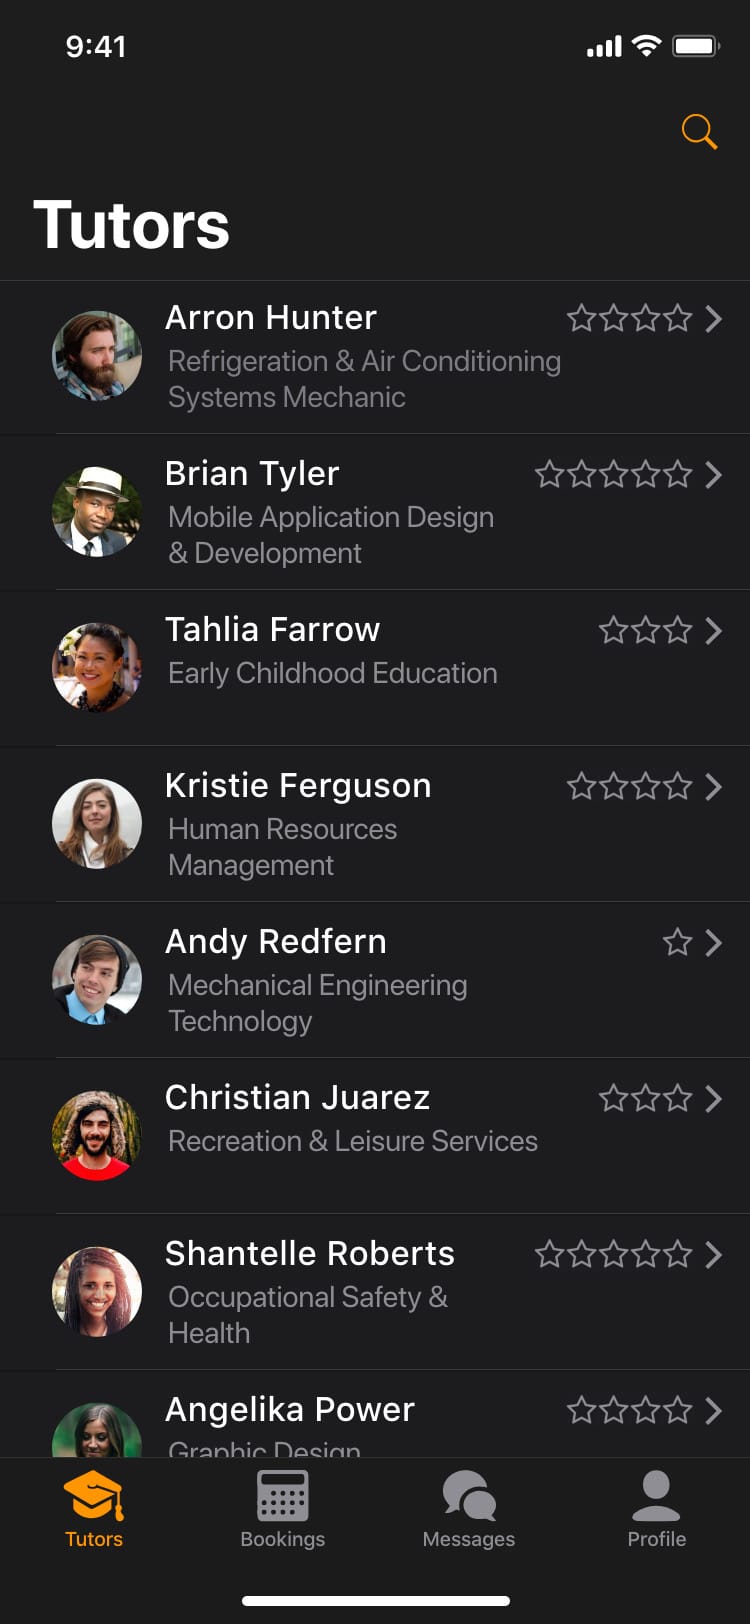

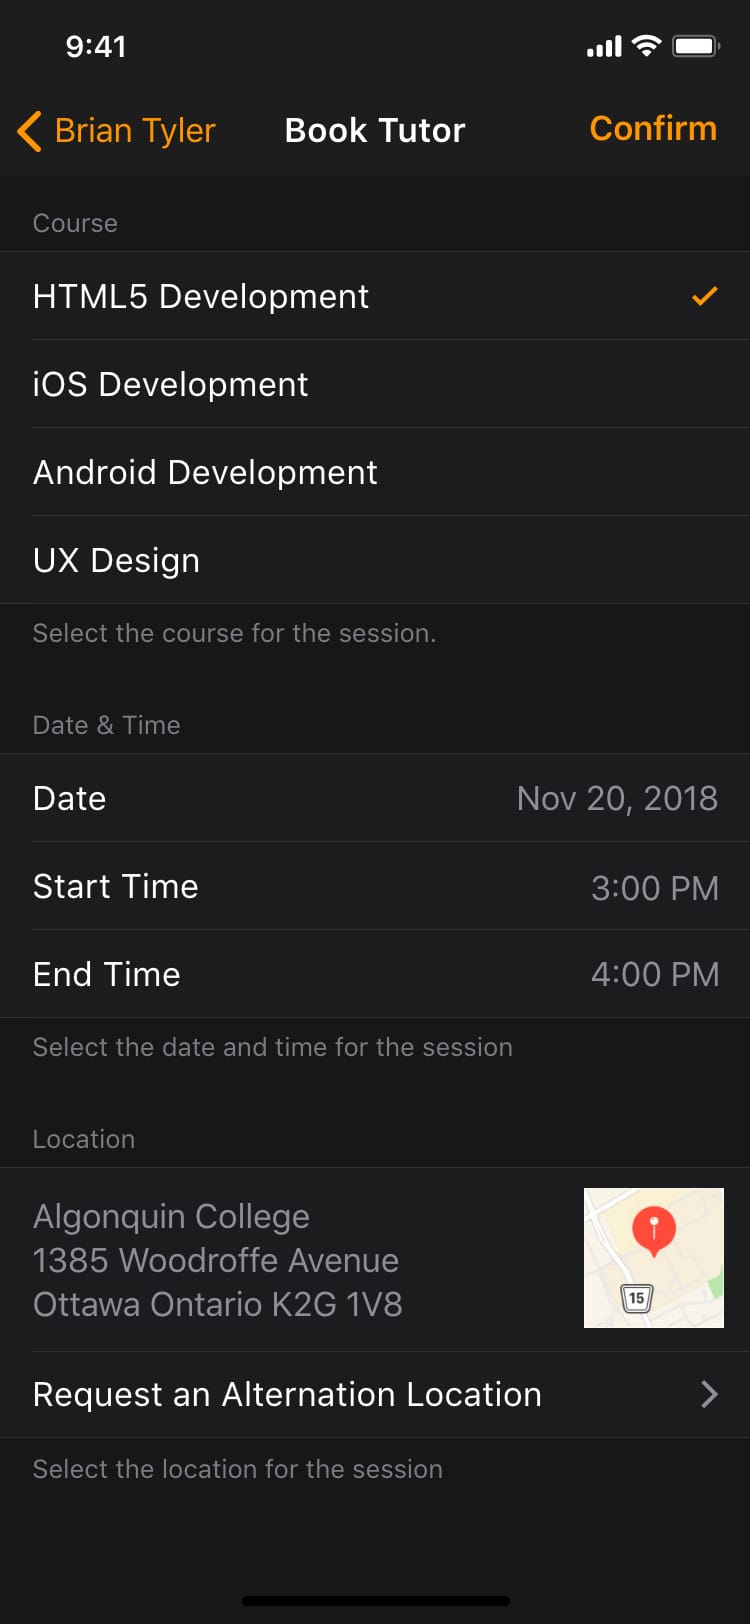


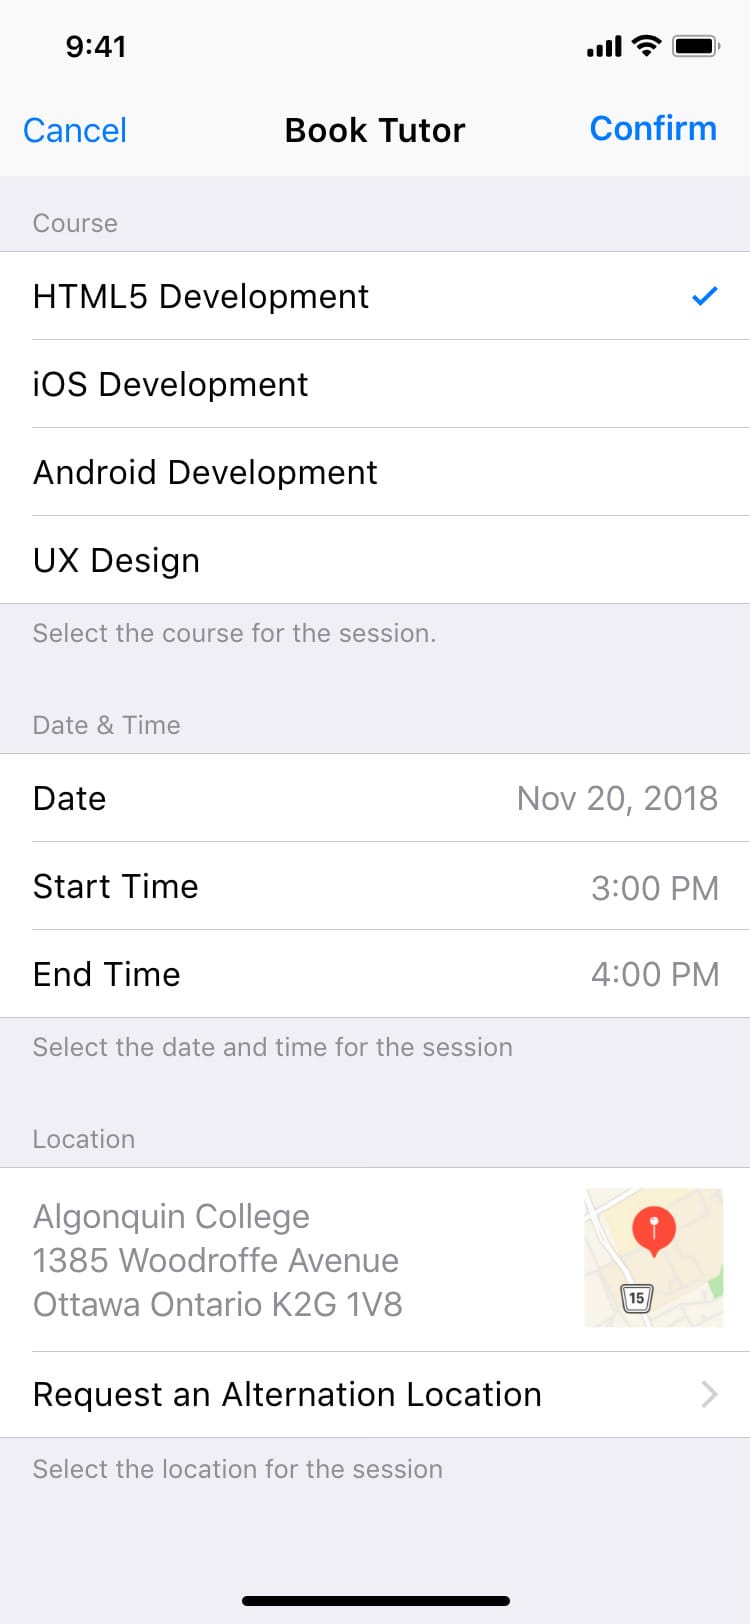
Lightning Tutoring
Lightning was a design project to create a tutoring app prototype. The goal here was to design the app to match the native iOS theme. Taking elements from various parts of iOS, I was able to come up with a clean and clear design. I then took the time to create a dark themed version, while still maintaining the iOS look and feel.
- Adobe XD
Pokédex Go
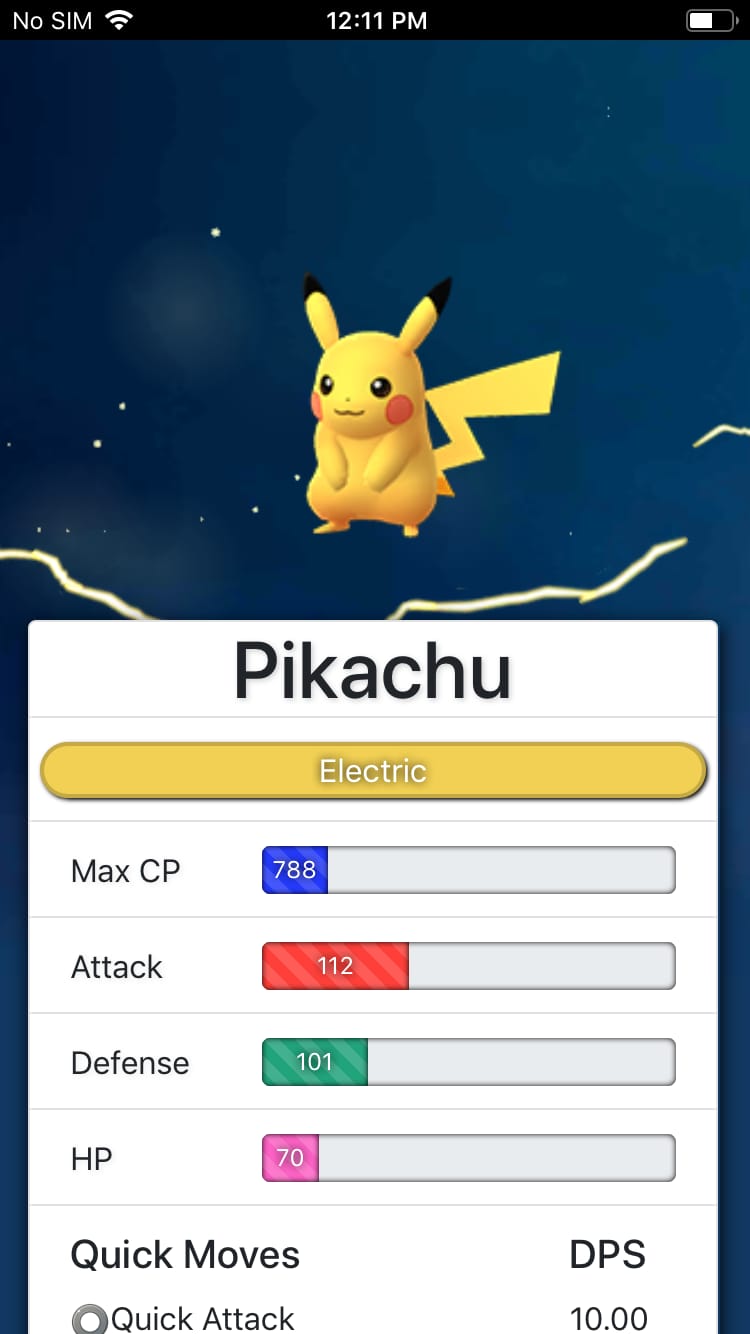
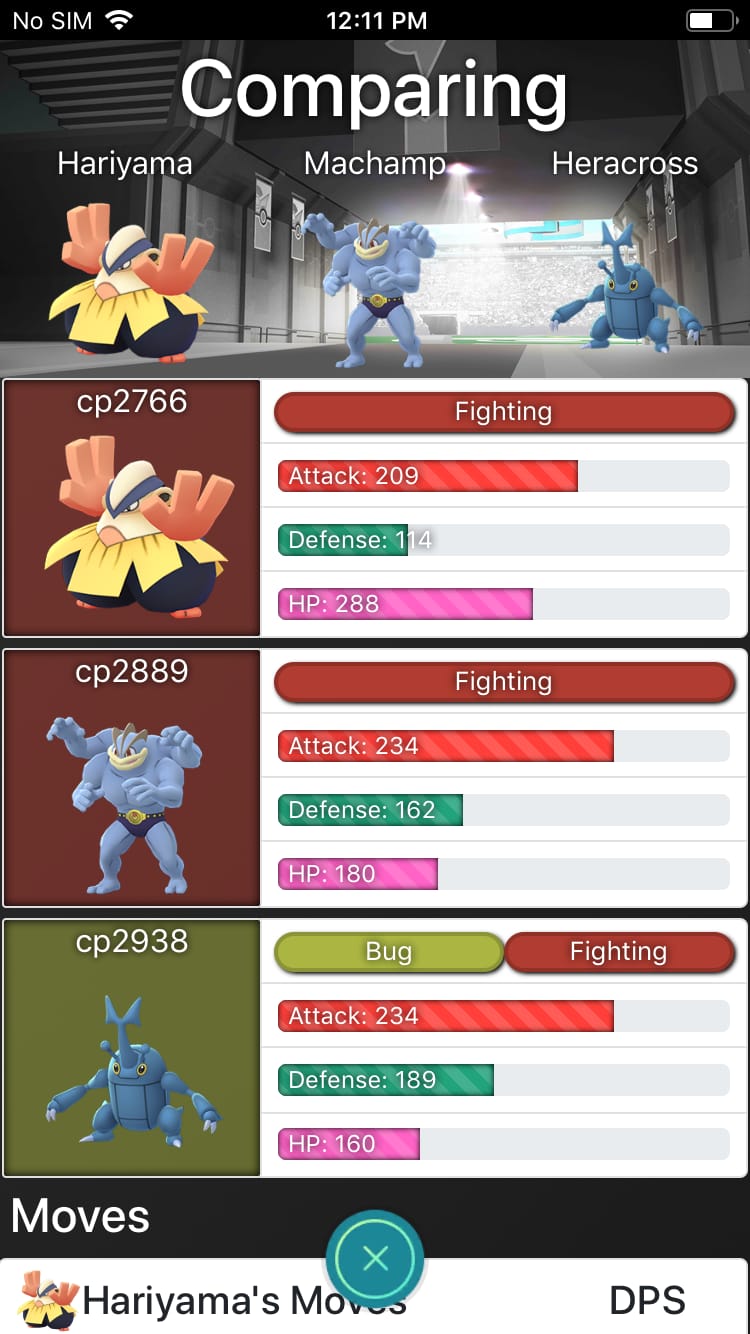
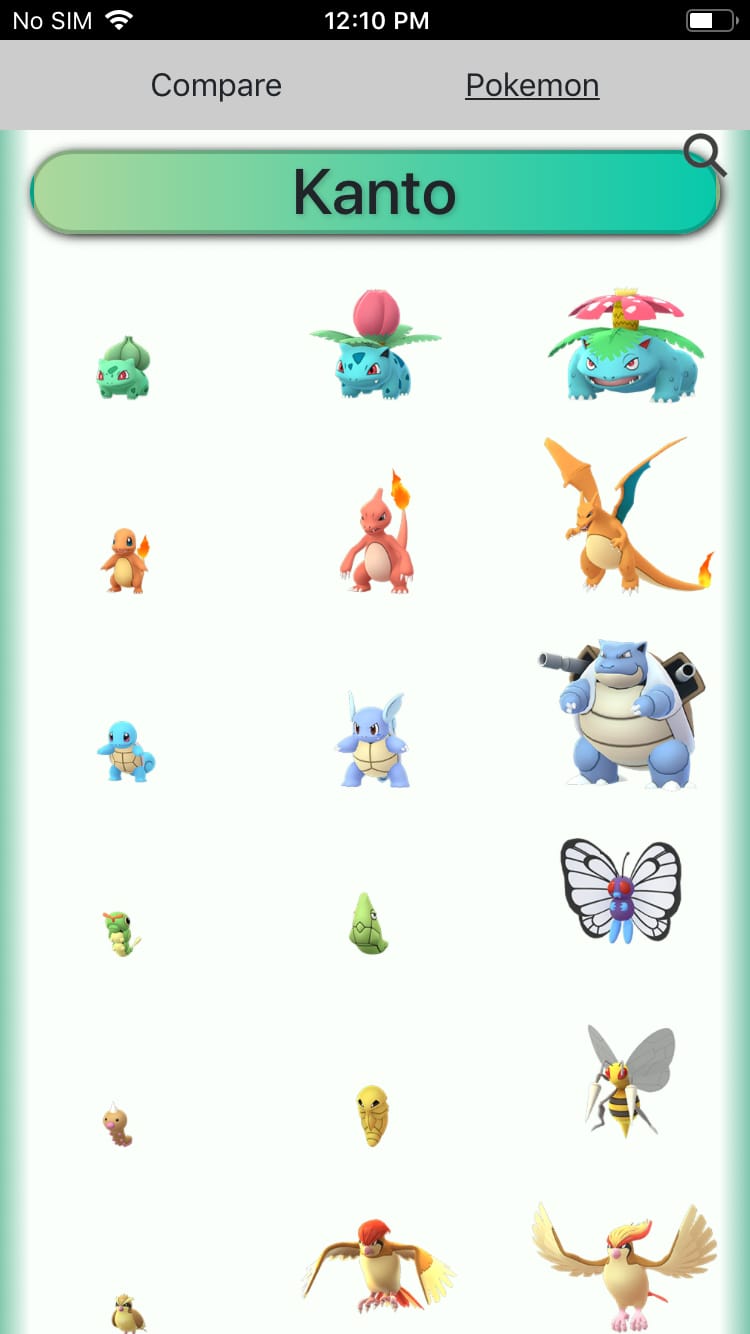
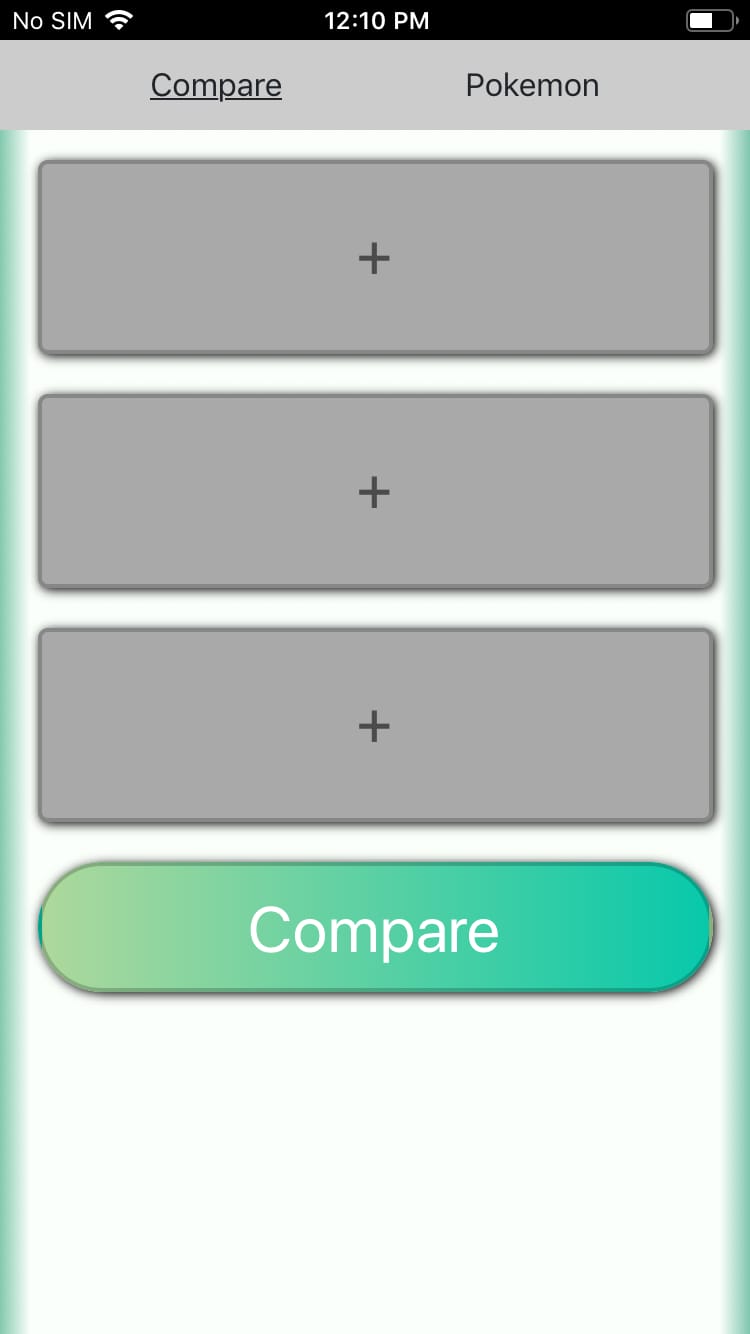
Starting out as a simple assignment, Pokédex Go grew into a large side project. We were to build a basic app with a list and detail view. I chose to base my app on the popular game Pokémon Go, creating a wiki like app for players. After submitting my assignment I began adding more features and screens, integrating tools like Google Analytics and added a JSON server used to detect updates and news items. I then rolled out the app by advertising on social media and began having daily users!
- Node.js
- JavaScript
- HTML
- CSS
- Google Analytics
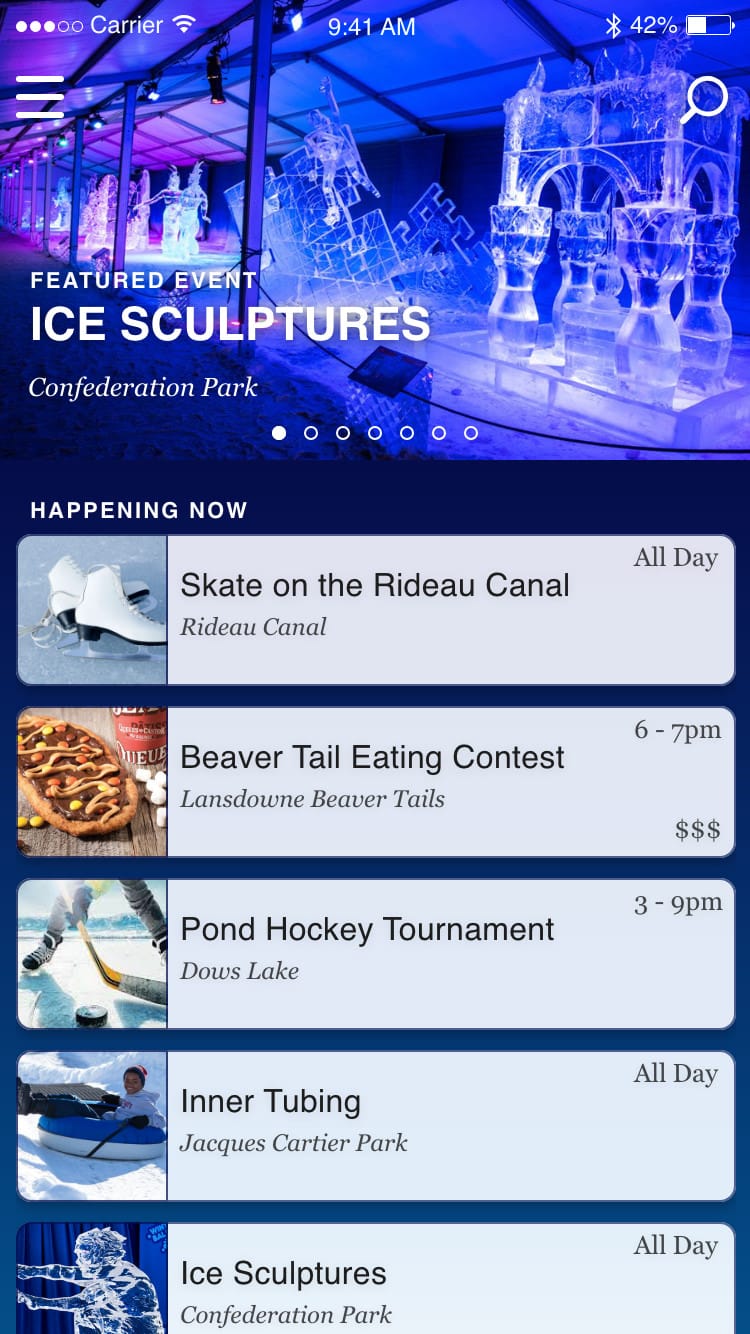
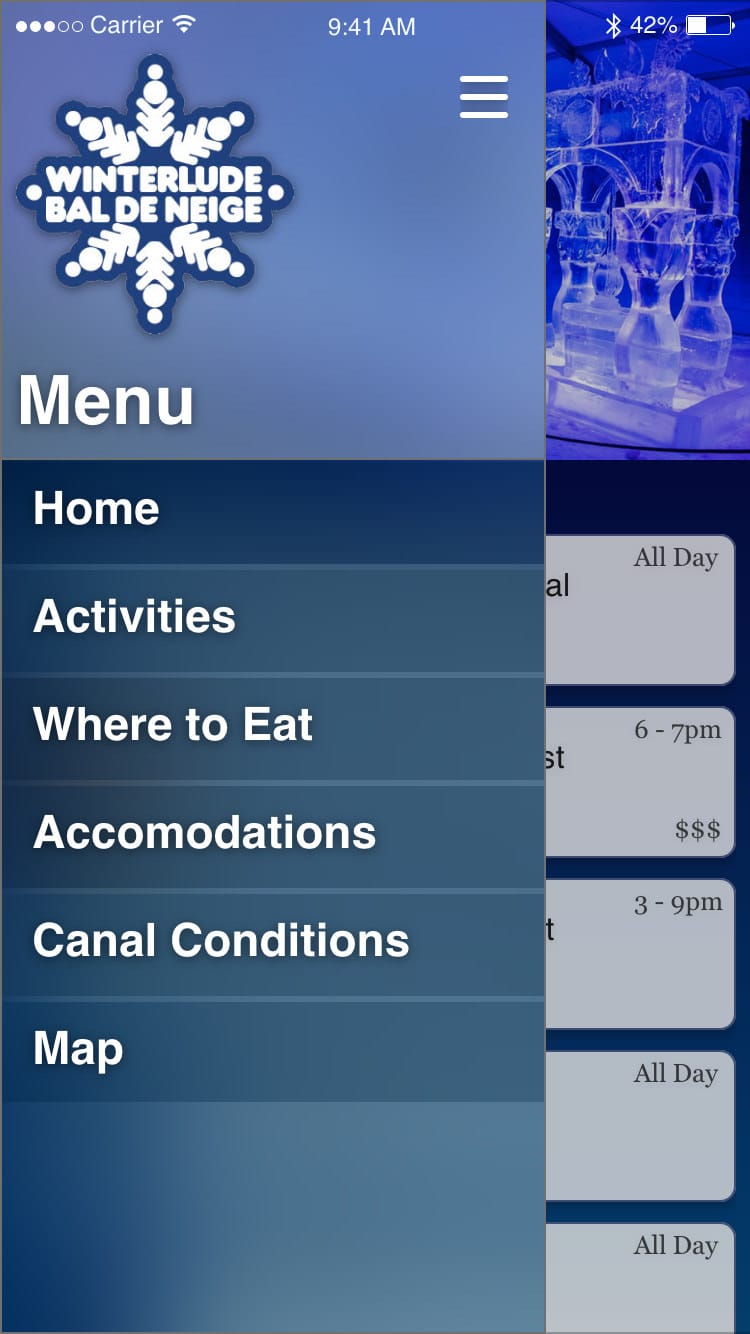
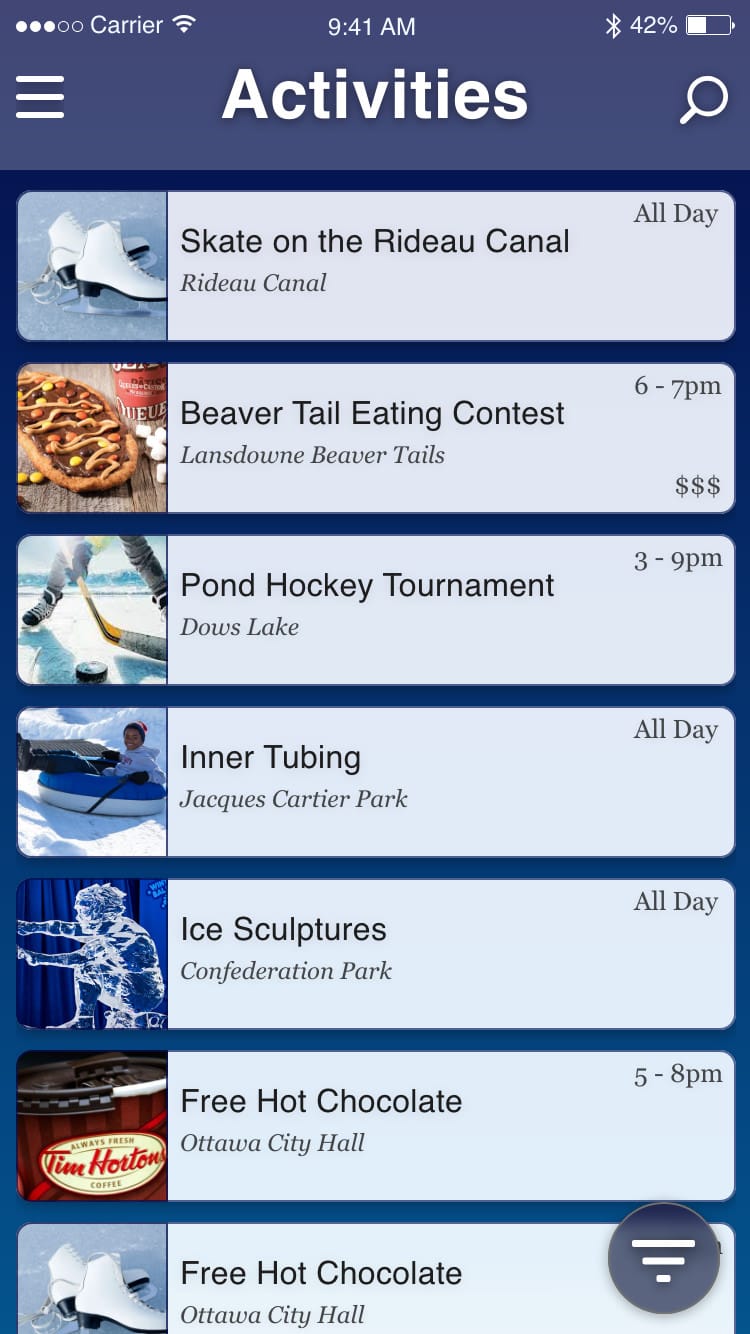


Winterlude App
This was an assignment in one of my design courses at Algonquin College. We were to design an app for Winterlude, a large winter festival that takes place in Ottawa. The prototype was built using Adobe XD, and features a handful of screens.
- Adobe XD
Many more!
Between client projects and private repos, I have many more examples that I’d love to be able to show you! If you’d like to see more of my work please don’t hesitate to contact me. You can reach me through any means listed at the top of the page, or via email or phone as listed on my resume.
- Node.js
- JavaScript
- HTML
- CSS
- MongoDB
- Figma
- Swift
- React
- React Native
- Next.js
- Pixelmator Pro
- Adobe Photoshop
- Amazon Web Services
- Microsoft Azure
- Google Firebase
- Google Analytics
- Canva
- Ghost CMS
- Monkey C
- Adobe XD